
Curious how TeamOhana can help you? Talk to us.
In this article
Never miss new content
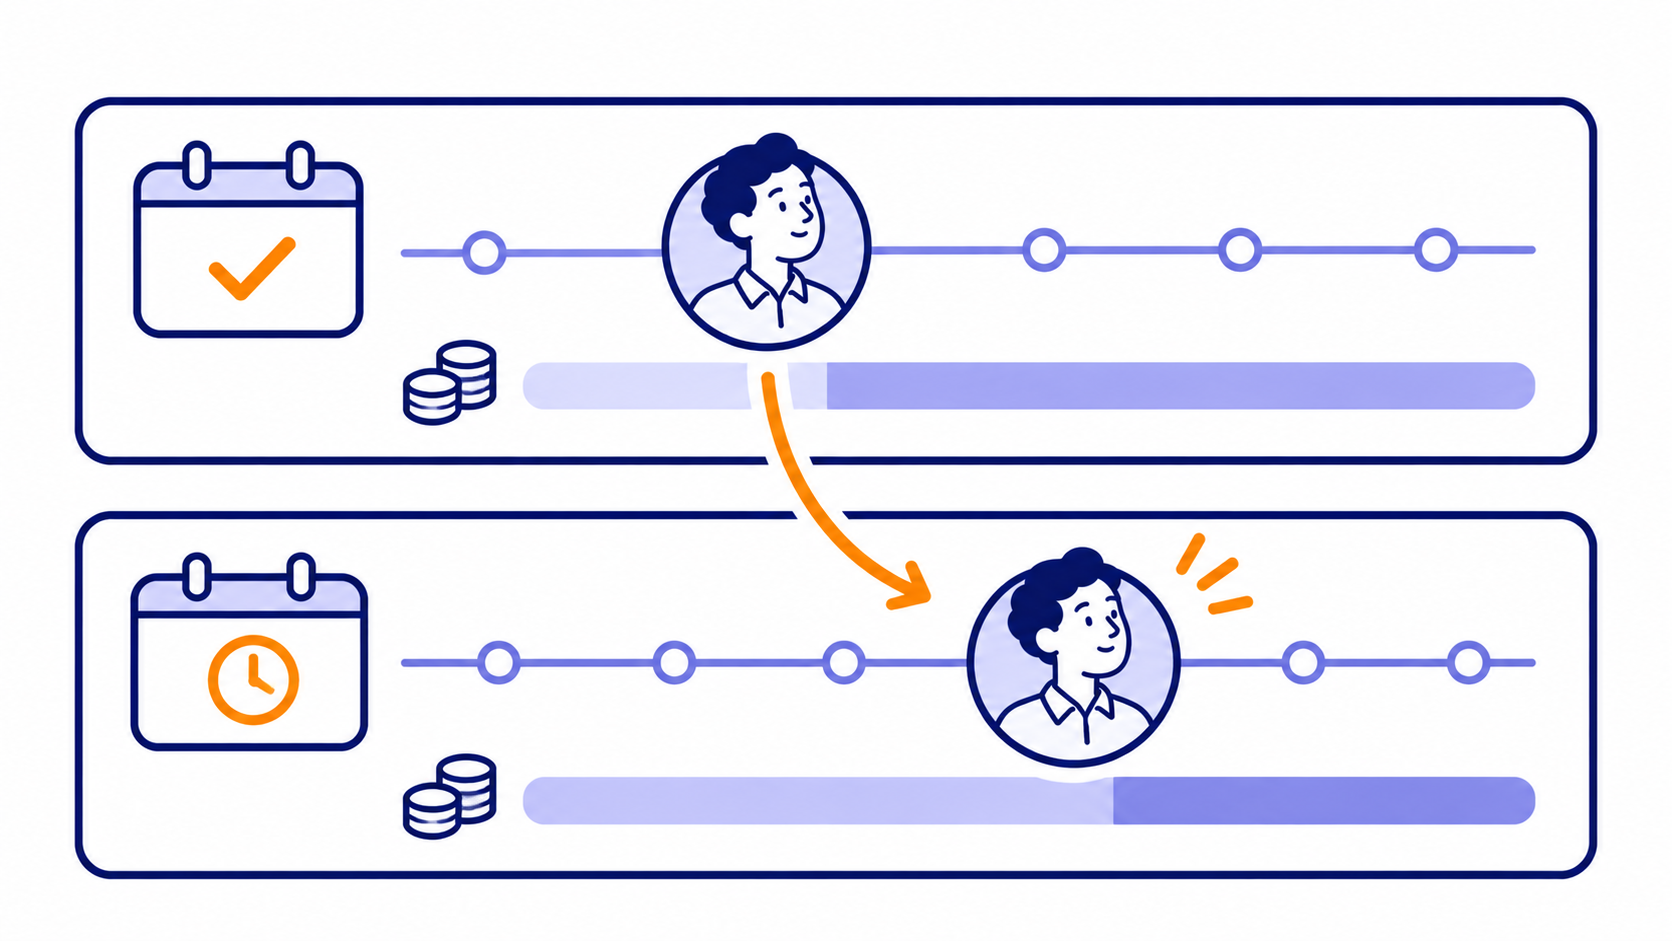
Short answer: A delayed hire lowers this fiscal year's workforce cost forecast and leaves the annual run rate exactly where it was. The spend moves. It doesn't disappear. Workforce cost modeling with hiring scenarios shows finance, HR and talent both numbers side by side, so a late hire reads as a timing shift, not a saving.
Here's the pattern I hear on almost every call our team has with finance, HR and talent leaders. The forecast comes in under budget. Everyone feels good for about a week. Then someone asks why the sales team is short four reps, why next quarter's hiring plan looks impossible, and why the board deck says the company is ahead of plan when it plainly isn't.
The forecast wasn't wrong, exactly. It was answering a different question than the one leadership was asking.
That gap matters more this year than most. Gartner's 2026 budget benchmarks show expected headcount growth falling from 6% in 2025 to 2% in 2026. When a plan has fewer hires, each one carries more of the growth story. A slip that used to be noise is now a real share of the plan.
6% to 2%: that's how far expected headcount growth fell between 2025 and 2026 in Gartner's CFO budget benchmarks. With fewer hires in the plan, every delayed start date carries more weight. (Gartner, 2026)
Our Head of Finance, Aaron Solomon, has written the deep guides on the math of delayed hiring costs and a workforce cost modeling checklist for open roles. This post zooms out. It covers what a delay does to each line of the forecast, how role changes pile on top, and how to model a whole plan with scenarios before the quarter makes the decision for you.
One delayed hire moves five numbers in your forecast
Most teams track one number when a start date slips: in-year cost. It drops, the variance turns green, and the conversation ends there. But a delay touches at least five lines of a headcount cost analysis, and they don't all move in the same direction.
The run-rate line is the one that trips people up. One large AI infrastructure company we spoke with this summer had more than 1,500 open positions. Their finance team made a sharp point: 50 hires that start in the last month of the year barely register in that year's cost, but they add their full salaries to the run rate going into next year. The in-year view makes late hiring look cheap. It isn't.
The same company found that about 90% of requested headcount simply used January 1 as the start date. Nobody expected those roles to start on New Year's Day. It was just the default field value. A forecast built on placeholder dates will come in under budget every single month, and that underspend will look like discipline.
So the first rule of workforce cost modeling for delays: always report fiscal cost and annualized cost next to each other. Fiscal tells you about this year. Annualized tells you what you've committed to.
Annualized run rate: the full-year cost of every role in the plan, as if each person were in seat for all twelve months. A delayed hire lowers fiscal-year cost, but the run rate stays the same, because the commitment hasn't changed.
What delayed hiring costs look like outside the payroll line
Aaron's guide walks through the productivity and ramp math in detail. For forecasting purposes, these are the costs that show up somewhere else in the P&L, or in next quarter, and get missed because no one ties them back to the open role.
Cover costs in a different budget line. Contractors, overtime and agency fees cover the empty seat. They usually land in a vendor or services line, so the headcount forecast looks clean while total spend doesn't.
Internal backfill chains. A UK software company described promoting a mid-market rep into an enterprise seat, then backfilling that seat from below, all the way down to an SDR. The external hire at the bottom started about eight weeks after the first move. One approved role, several cost centers changing, and a delay nobody had planned for.
Recruiting capacity that stacks up. Delayed roles don't leave the queue. They pile onto next quarter's. SHRM's 2025 benchmarking puts the median at 20 requisitions per recruiter a year overall, rising to 50 at organizations with 500 to 4,999 employees and 60 at 5,000 or more. If a quarter's worth of roles slips, your recruiter capacity plan for the next quarter is already wrong.
Approved but not opened. A fintech finance team told us their biggest blind spot was roles that were fully approved but never opened, because recruiting didn't have the bandwidth to start them. Those roles sit in the forecast with start dates that can't happen.
Slower trade-off decisions. An HR leader at a large field-service software company put it simply: finance's forecast and what talent is recruiting against drift apart, roles slip by quarters, and budget trade-off decisions slow down. The cost here is a decision that gets made a month late, or not at all.
Role change impact: role changes and delays usually travel together
A delay changes when cost lands. A role change changes how much. In practice, the second often causes the first, which is why role change impact belongs in the same model as hiring delays.
An operations software company with about 40 open roles told us that re-levels and location changes restart the hiring process. Change the level mid-search and the clock resets. A large field-service software company said the same about splitting one senior role into two junior ones: cheaper on paper, slower in practice, with two ramps instead of one.
When role changes happen without a cost check, they add up fast. A large public tech company said manager self-service up-leveling pushed spend over budget, so finance had to add controls after the fact. A profitable fintech described budgeting an L5 and hiring an L4, which sounds like good news until you realize finance can no longer trust the plan in either direction.
The fix is simple to say: re-cost every role change before it's approved, and report its run-rate impact separately from date variance. If date and pay are lumped together, a role that's both late and over level can look perfectly on budget. Aaron covers the full role-change math if you want the formulas.
Hiring scenario modeling: how to forecast a plan that will slip
One forecast with one set of start dates is a guess dressed up as a number. Hiring scenario modeling replaces it with a small set of versions of the same plan, each with an honest assumption about timing. Here's the workflow we see working at growth-stage and enterprise companies.
- Start from the approved plan, with no dates in the past. Any open role whose target start date has already passed gets moved. One operations software team said finance asks the same question every month: why are there ten roles with a start date of last month? Clear those first.
- Build a slip assumption from your own history. Use actual time to fill by location and role family, plus notice periods. A manufacturing software company found their Budapest roles took about five months to fill while the plan assumed two. SHRM's 2025 data is a useful outside check: median time to fill is about a month and a half overall and 61 days for nonexecutive roles at organizations with 5,000+ employees. That's requisition to accepted offer, before anyone gives notice.
- Create three scenarios. On plan (every role starts as approved), expected (your historical slip applied), and stressed (a longer slip, or a quarter's worth of roles that never opens). Keep them as copies of the same plan so the only difference is the assumption.
- Layer in known role changes. Re-levels, location moves and split roles go into every scenario, so you can see what's driven by timing and what's driven by pay.
- Compare fiscal and annualized cost for each. Fiscal shows this year's budget impact. Annualized shows what you're committing to. Add exit headcount, since that's the number the board will ask about.
- Pick the forecast and decide the trade-offs. Most teams submit the expected scenario as the forecast and use the stressed one to agree in advance what they'd do: which roles to protect, which to push, and whether favorable variance can be reallocated.
- Re-run it monthly. Recruiting updates near-term dates, finance re-runs the scenarios, and the gap between expected and actual becomes your best early signal. Aaron's monthly rhythm lays out who does what.
Worked example: a 12-role plan in three scenarios
Take a plan with 12 open roles at $200,000 fully loaded each, in a January to December fiscal year. Four are budgeted to start April 1, four on July 1 and four on October 1. Fiscal cost for each role is its fully loaded annual cost multiplied by the months it's employed in the year, divided by 12.
The expected scenario shows a $400,000 favorable variance. The stressed one shows $733,333. Neither is a saving. The run rate is $2.4 million in every column, and in the stressed case four hires slide into next year, where they'll compete with next year's plan for the same recruiters.
Now layer in one role change. Two of the October roles get up-leveled to $240,000 each. The on-plan fiscal impact is just $20,000, because there are only three months left in the year. The run-rate impact is $80,000, every year, starting now. If you only look at the fiscal view, a permanent cost increase looks like a rounding error.
A $400,000 favorable variance on a $2.4 million run rate isn't a saving. It's a timing gap, and the conversation should be about what to do with it, not where to spend it.
This is why the expected scenario, not the on-plan one, should usually be the forecast you hand to leadership. And it's why the conversation about that $400,000 should be "what do we do with a timing gap?" and not "where should we spend our savings?"
Workforce planning is a three-team job
No single team can model delays well on its own. Finance owns the numbers but not the pipeline. Talent knows the pipeline but not the budget. HR sees role changes first but often isn't in the forecast meeting. Here's how the work splits when it goes well.
The hardest part is getting talent's dates into finance's model. A manufacturing software finance lead compared recruiting's start dates to a salesperson's close dates: optimistic, every time. That's not a knock on recruiters. They're closest to the pipeline, and hope is part of the job. It just means start dates need a second look before they go into the forecast.
An HR leader at a field-service software company named the other side of the problem: "We find out after the fact." Without a live view of whether hiring is on pace, misses show up in the variance report a month later. A high-growth audit software company asked for the fix directly. Their executives wanted a fill-by-quarter view split into on time, delayed and pushed out. That's three buckets, refreshed monthly, and it changes the conversation.
How TeamOhana handles delayed hires and role changes
You can do all of this in a spreadsheet. Plenty of teams do. The trouble is that the spreadsheet goes stale the week you build it, because hiring changes every week. TeamOhana works alongside your HRIS and ATS, not instead of them, and keeps the plan connected to what's actually happening.
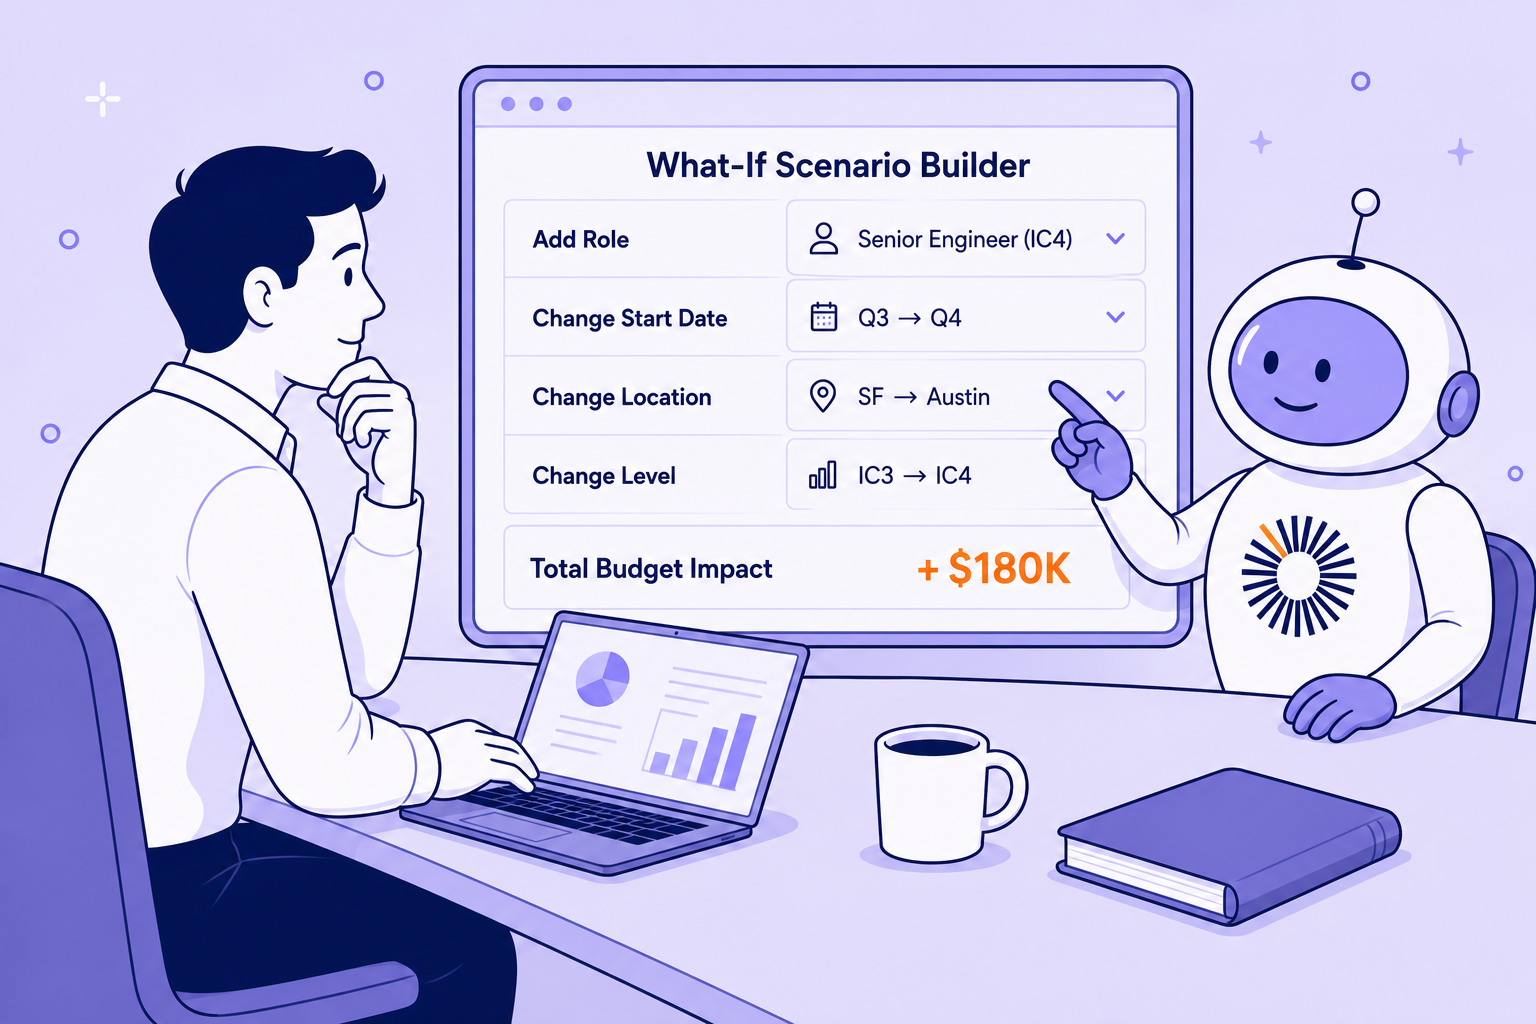
- Scenarios for what-if planning. Build a Modify Plan scenario, clone it into best and worst cases, and push or pull roles without touching the live plan. Nothing goes live until it's approved and merged. Scenarios also run natively in TeamOhana Computer, so you can ask "what if these six roles slip 60 days?" in plain language.
- Impact panel with both views. Every scenario shows budget, forecasted cost and variance on a fiscal-year and an annualized basis, with a department-by-department breakdown of each change.
- Realistic start dates by default. Target start dates come pre-filled with a recommendation based on your own historical time to fill for similar roles and locations, and aggressive dates get flagged. Roles that are past due or at risk of missing their date are flagged too.
- Variance that explains itself. The Variance Tracker splits variance into date variance (early or late hiring) and compensation variance (higher or lower pay), and calls out non-budgeted hires separately.
- A forecast that accounts for slippage. Predicted Forecast shows where headcount will likely land at period end, factoring in hiring slippage and attrition the plan doesn't show yet.
- Fully loaded cost. Load factor rules apply to both open roles and people in seat, so every scenario compares real costs, not just base salary.
TeamOhana isn't trying to replace your FP&A platform. It feeds it current, accurate headcount cost data, so the model your finance team already trusts is built on start dates and role costs that reflect reality.
If your forecast keeps coming in under budget for reasons nobody can explain in one sentence, that's worth a look. Manage headcount without the headache. Book a demo.
Take control of your headcount spend

Delayed hires and workforce cost forecast FAQs
Simplifying TeamOhana: your questions, answered.
A delayed hire lowers the fiscal-year cost forecast, because the role is on payroll for fewer months this year. It doesn't change the annualized run rate. If the delay crosses year end, it also lowers exit headcount and pushes the hire into next year's recruiting load.
The budget assumed the role would be paid from its planned start date. When the start date slips, those months of cost don't land, so actual spend comes in under budget. That variance is a timing difference, not a saving, and it often hides lost output and cover costs elsewhere.
Hiring scenario modeling builds several versions of the same headcount plan, each with a different assumption about start dates or role changes. Teams typically compare an on-plan, an expected and a stressed scenario on fiscal cost, annualized cost and exit headcount before choosing the forecast.
Role changes such as re-levels, location moves or splitting one role into two change the run rate, not just this year's cost. They often delay hiring too, because the search restarts. Re-cost every role change before approval and report it separately from date variance.
A useful headcount cost analysis includes fully loaded cost for people in seat and open roles, realistic start dates, fiscal and annualized views side by side, exit headcount, and variance split into timing, pay and added roles.
Monthly works for most growth-stage and enterprise companies. Recruiting updates near-term start dates, HR flags role changes, and finance re-runs the scenarios before the monthly forecast is locked.