.svg)


.svg)


Integrations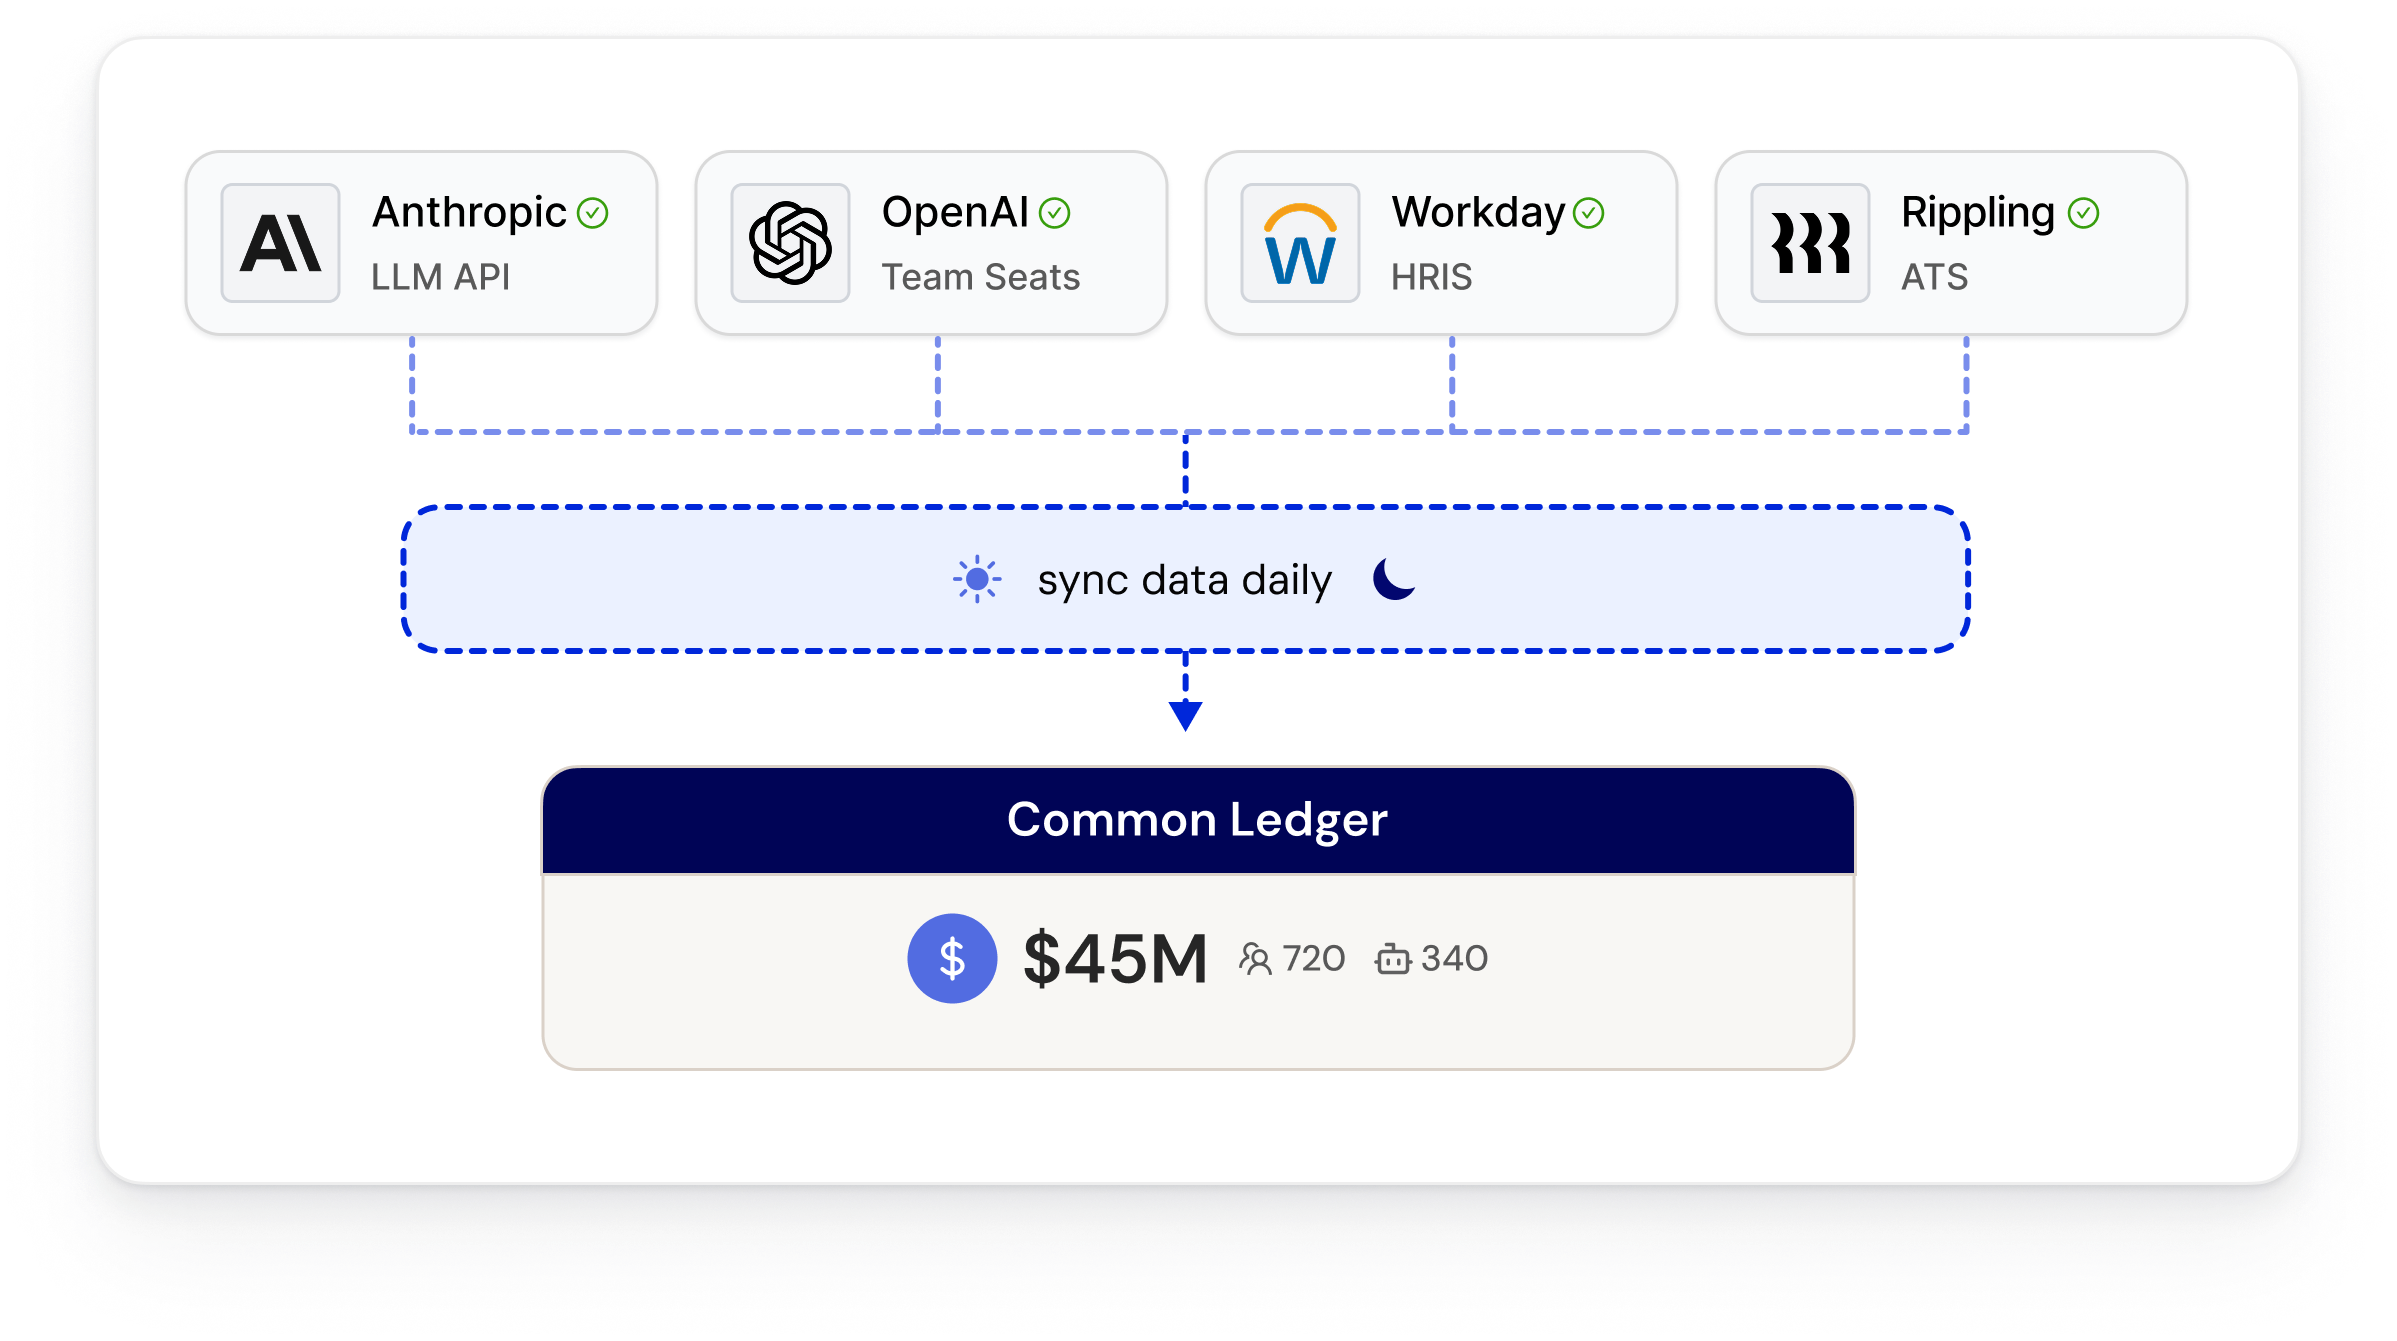
Two systems. One ledger.
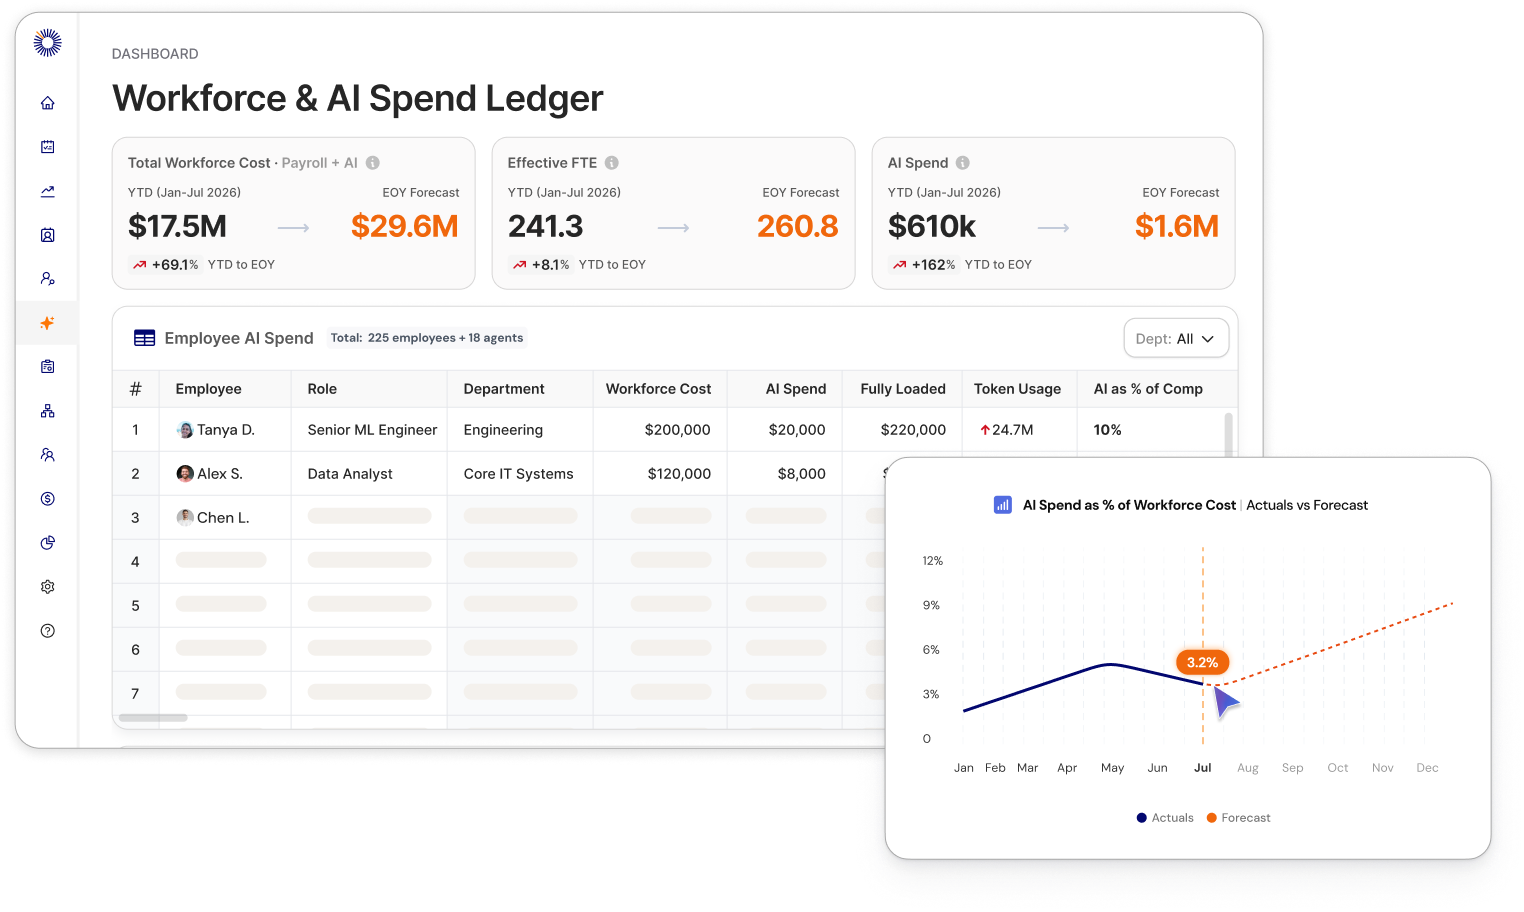
Token data tells you what was spent. The employee record tells you what it means. Only TeamOhana puts both inside the headcount plan. That is what lets you see AI spend as a percentage of payroll spend.
AI sources Anthropic
 OpenAI
 Cursor
 AWS Bedrock
 Glean
Glean
SC
Seat & contract importsWorkforce systems Workday
 BambooHR
 ADP
ADP HiBob
HiBob Rippling
 UKG
UKG
Every source. Even the ones exports miss.
Your biggest spend is in enterprise plans, agent cloud bills, and contractor keys. Exports do not cover them.
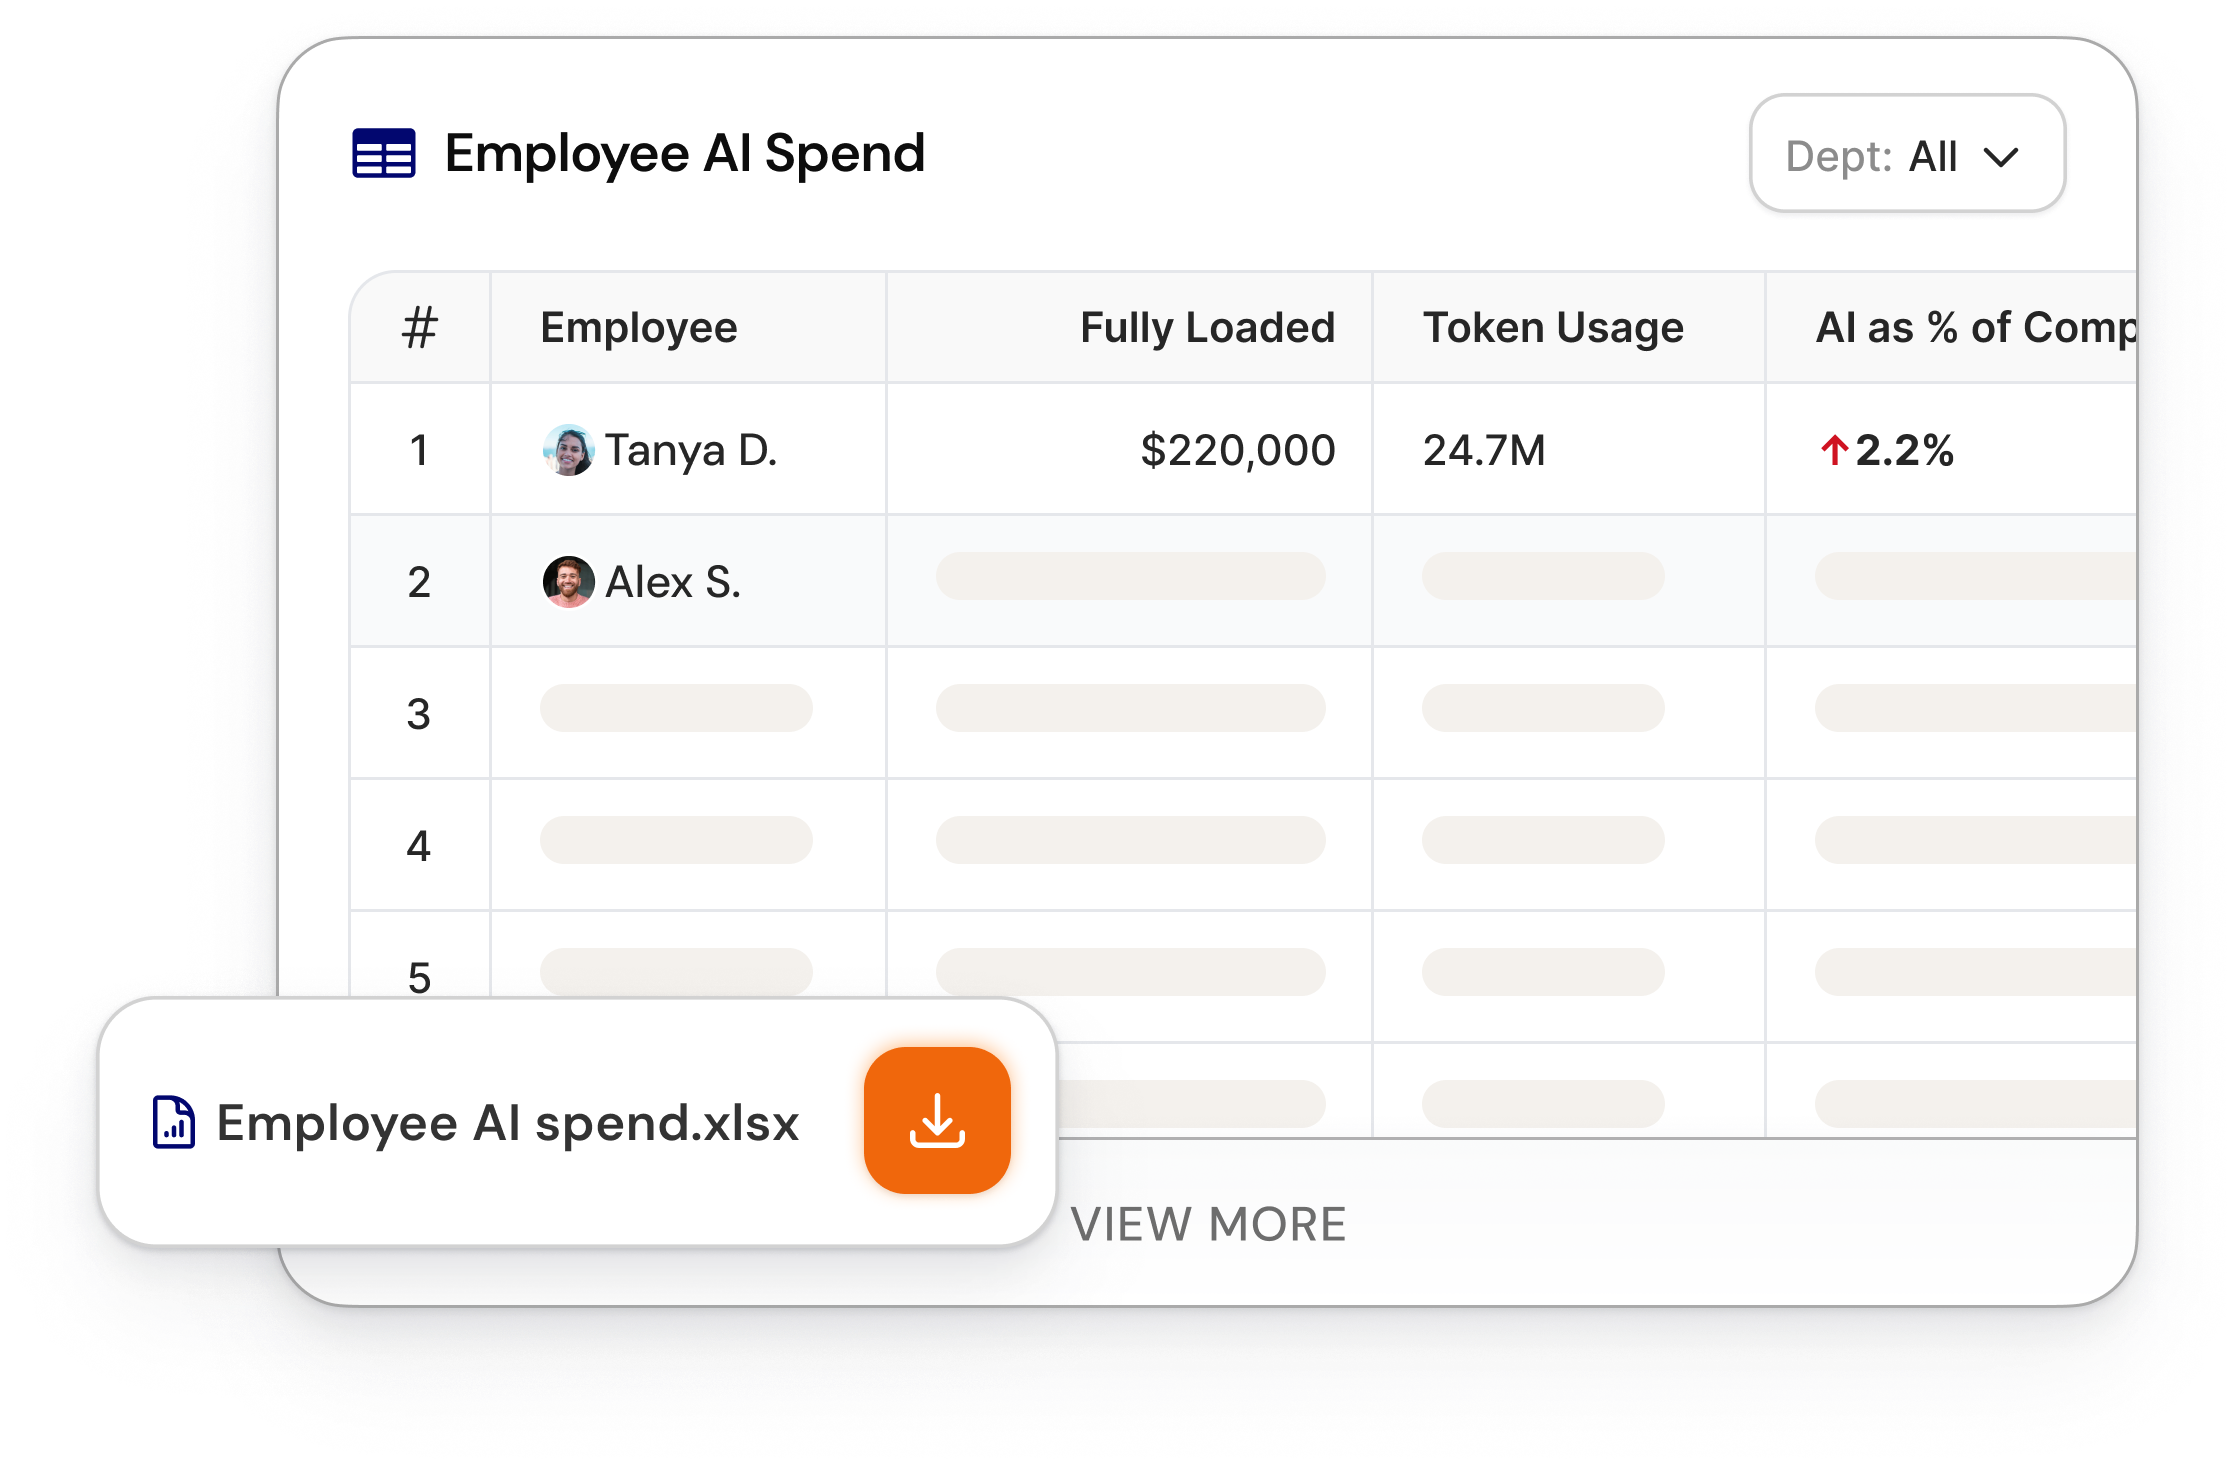
- Every dollar attributed to a person, a team, or an agent, with an owner to contact.
- No double counting. When two sources report the same dollars, the ledger keeps one clean number.
- Seats amortized daily. A license and an annual contract read as what they cost per day.
Totals miss the outlier.
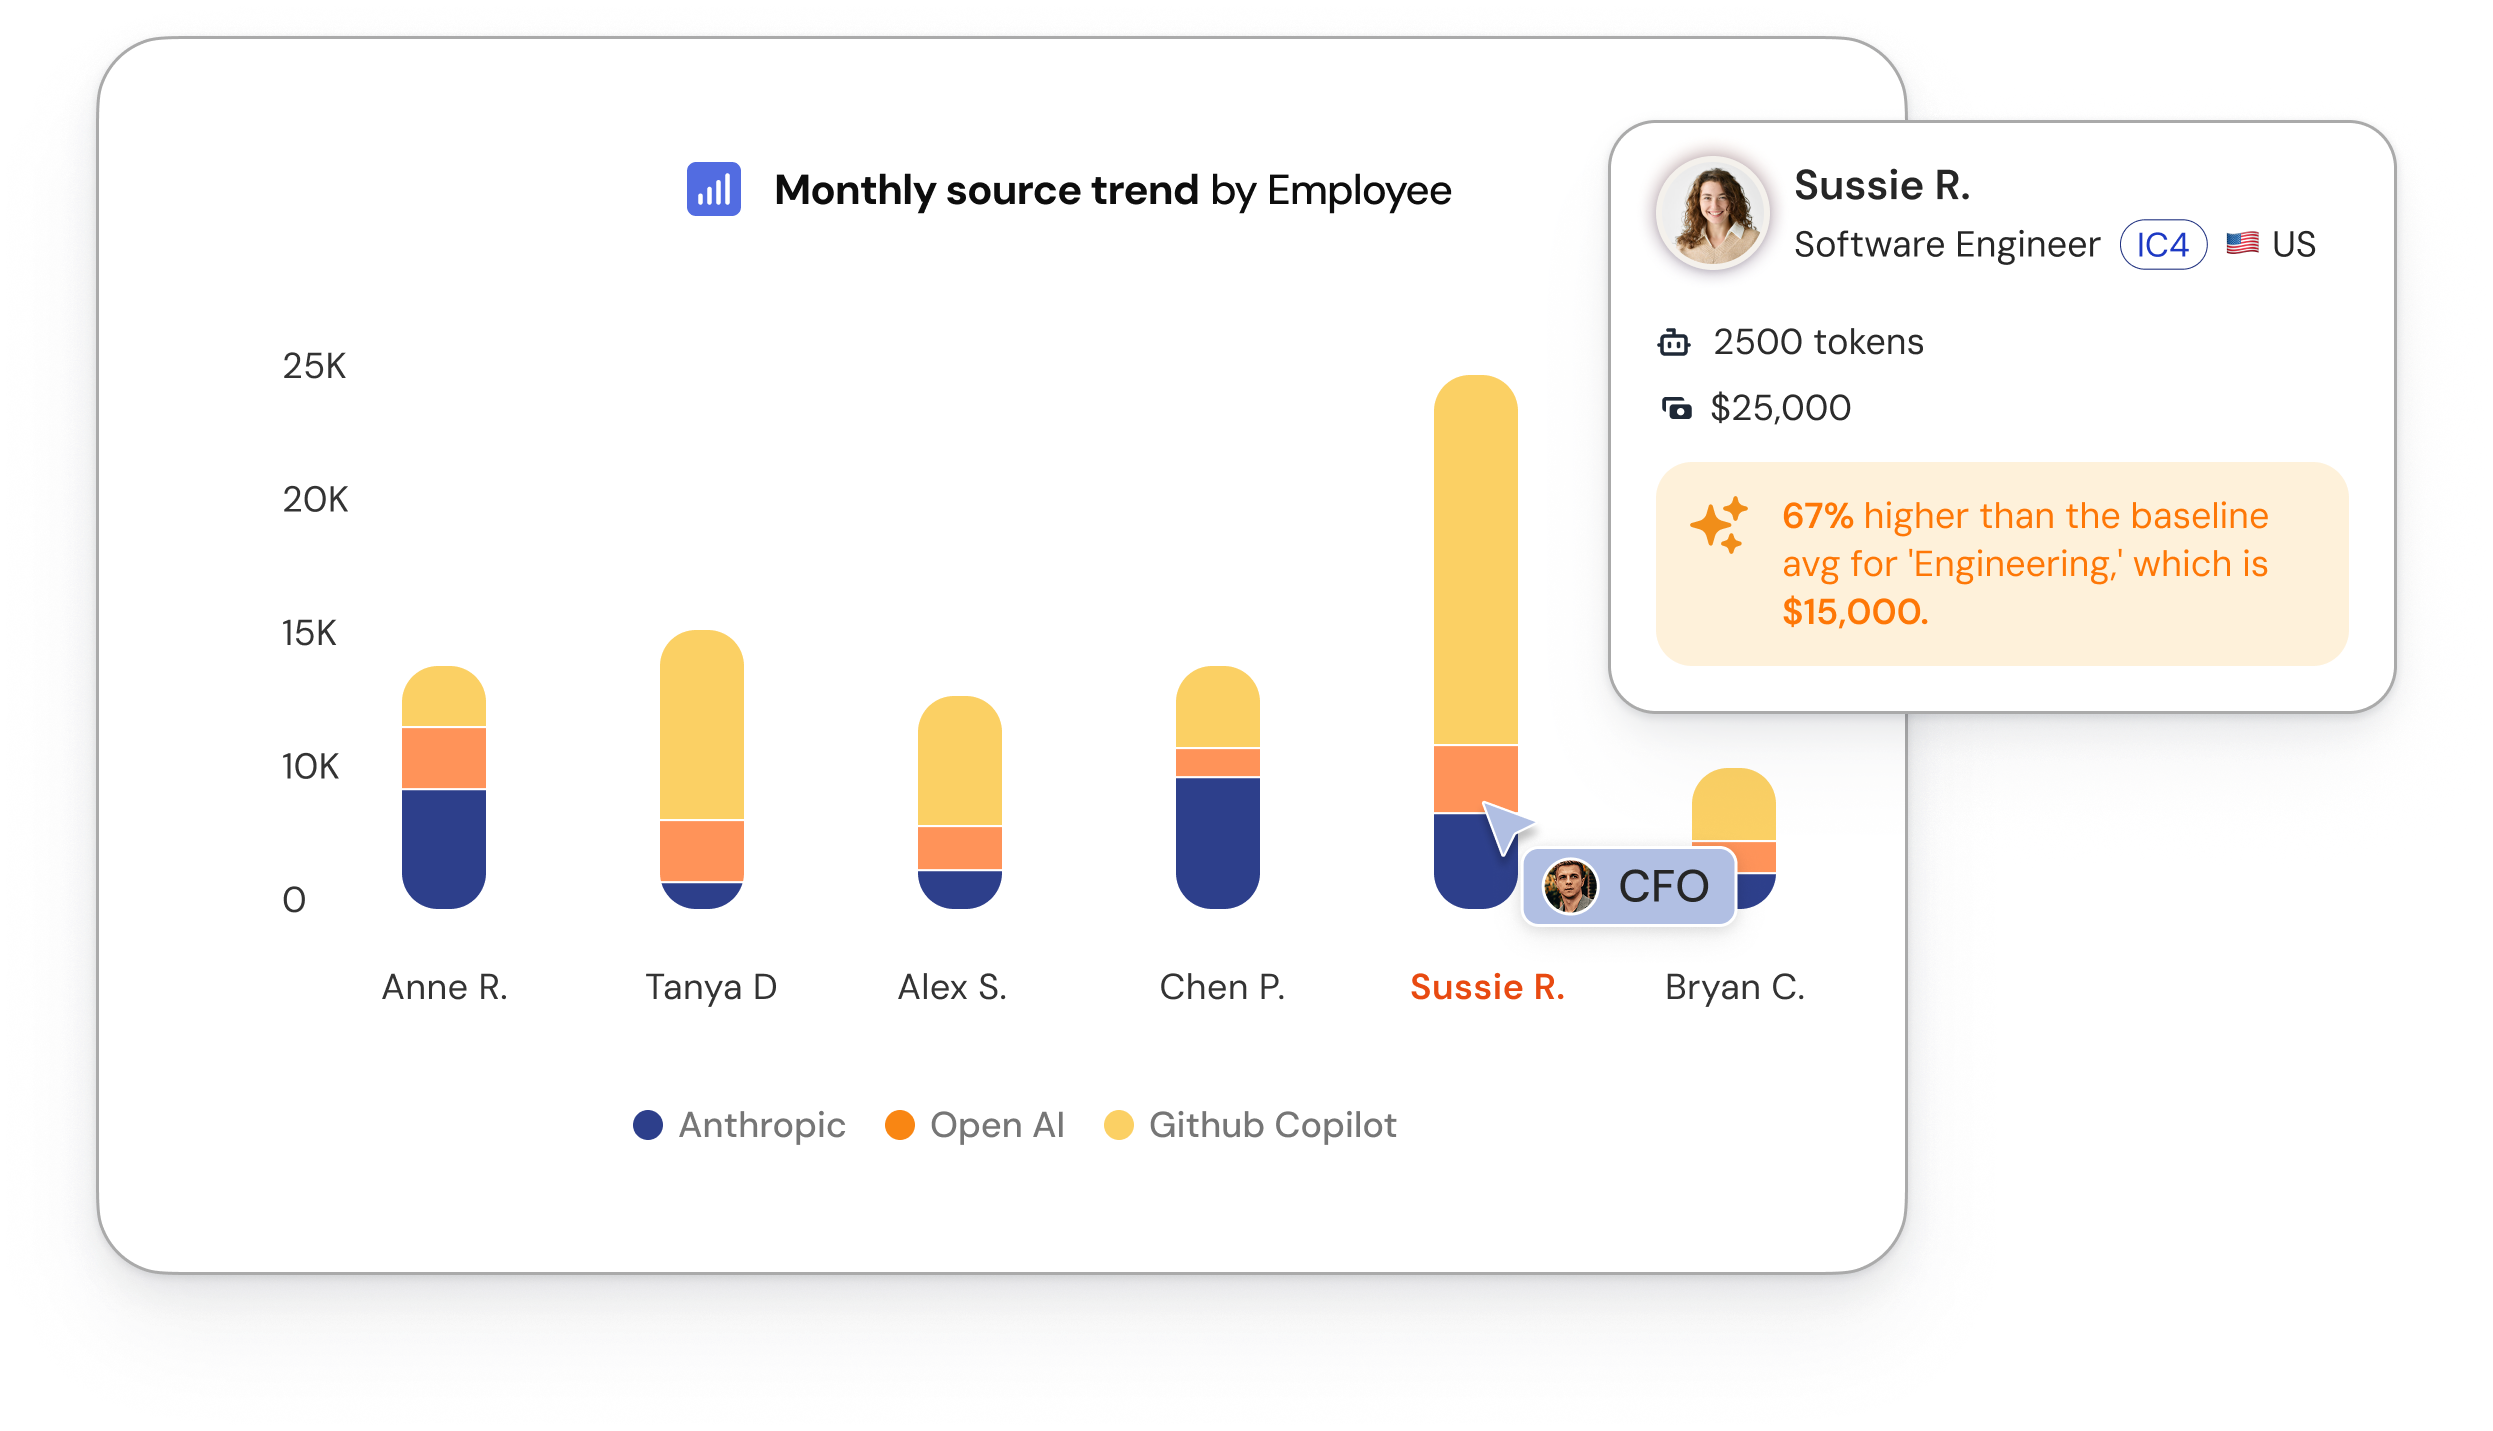
A team spending heavily can be a work style. One person spending ten times their team's baseline is a problem. Baselines separate the two.
- Outliers against team baselines, not raw totals.
- An owner on every key and agent, with the model mix behind the spike.
Where finance plans both workforces.
Two workforces. One budget. No dashboard can do this.
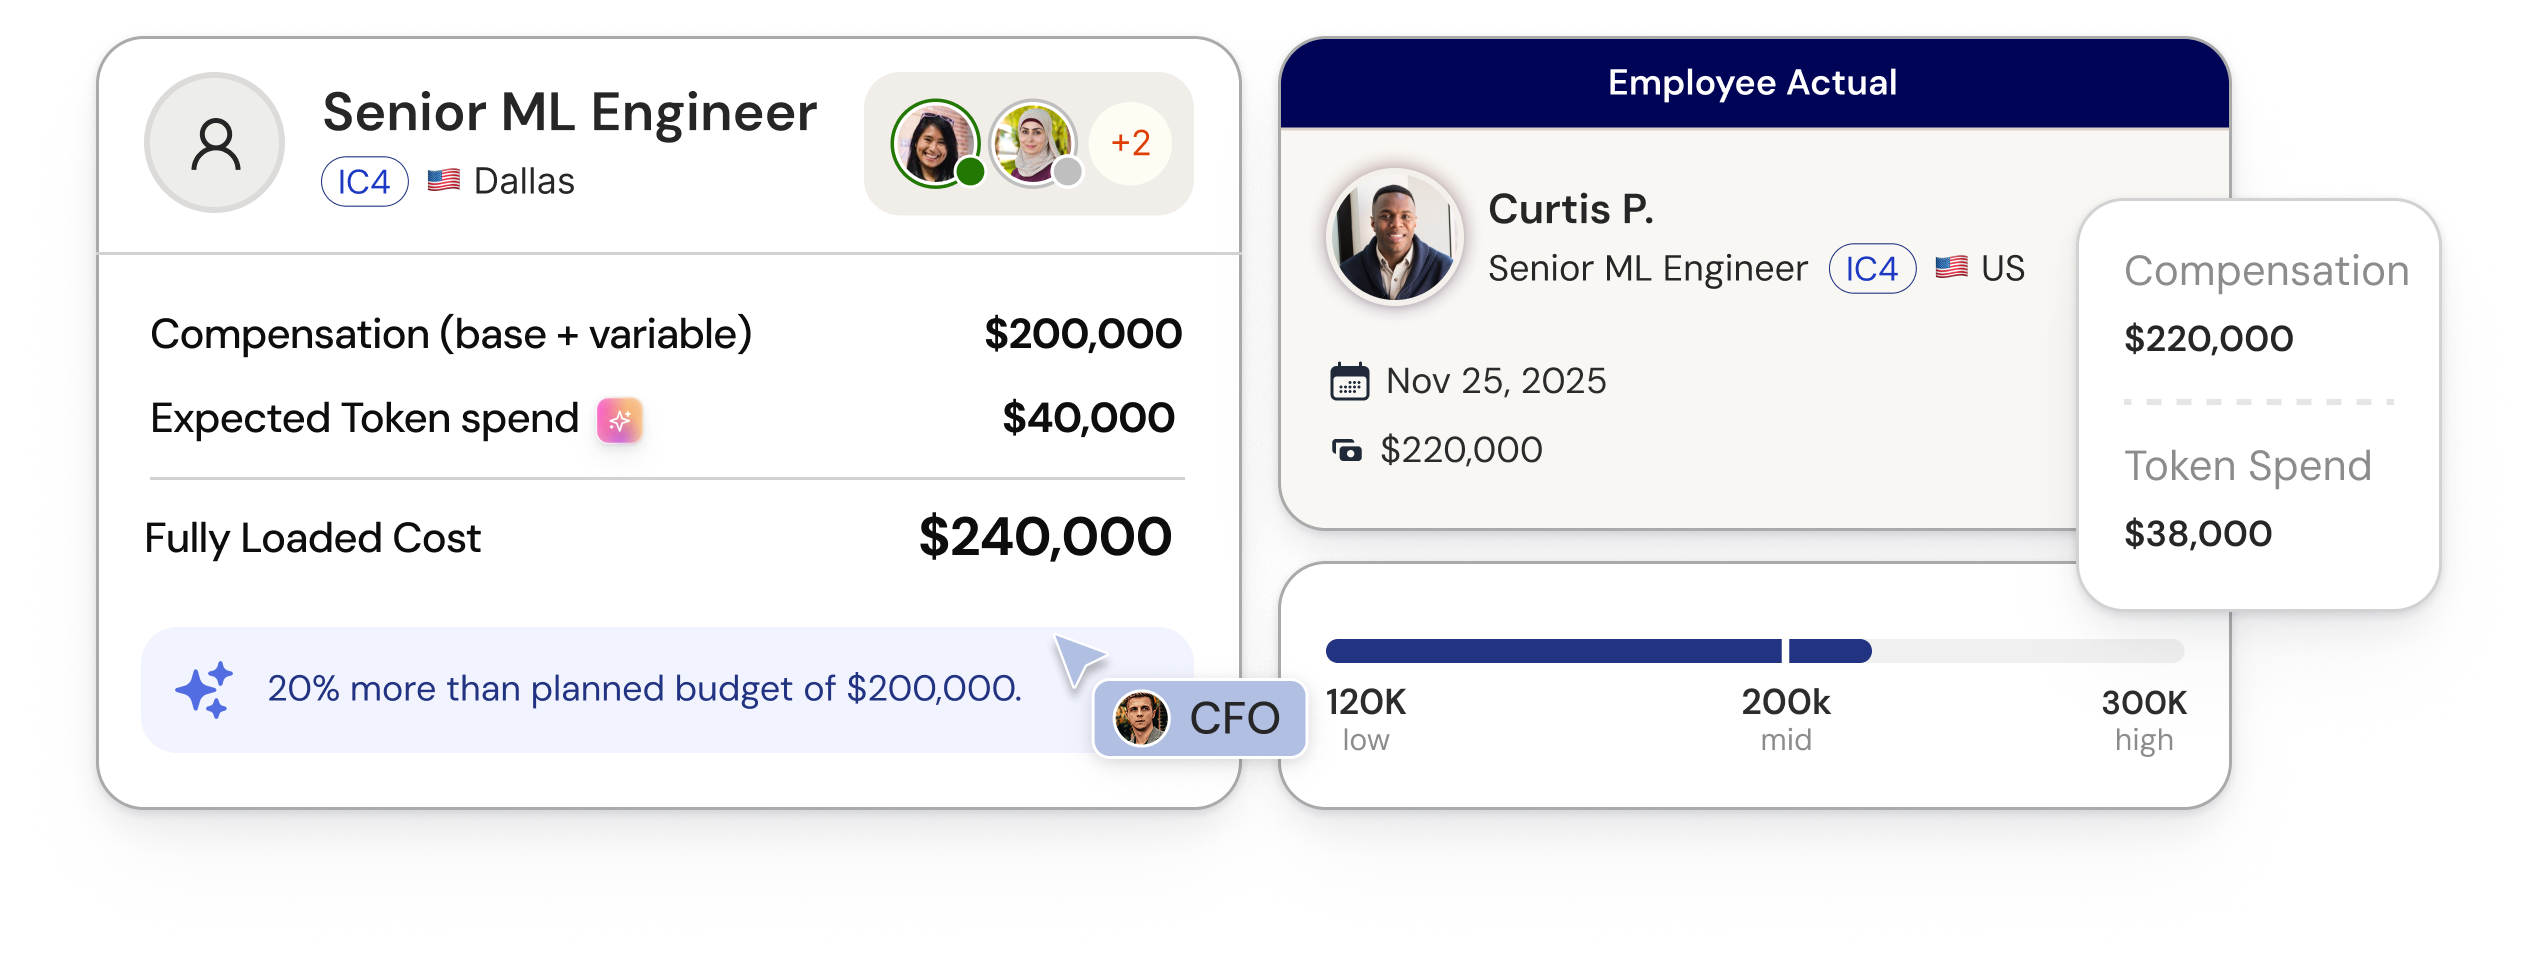
One budget. Three ways to spend
HireNew engineers, with token spend attached from day one.
FundMore tokens for the engineers you already have.
DeployStandalone agents, budgeted like the workforce they are.
See AI spend as a percentage of payroll spend
Your data, not a sample.

“Having all AI spend in one place is the big thing.
A new engineer adds incremental payroll and incremental AI spend, and we now budget for both together.”
Elisa Folden, Sr. Manager Business Systems

Why not a free dashboardSpend dashboards are free now.
Spend dashboards are free now.
None of them can budget your next hire.
| Free spend tools | TeamOhana | |
|---|---|---|
| Spend by user and model | Yes | Yes |
| Employee-level attribution | Yes, per user | People and agents, with role, comp, and an owner |
| AI spend as a percentage of payroll spend, per person | No | Yes, per employee |
| Forecast at the headcount request | No | Every planned hire, priced |
| The annual planning tradeoff | No | Hire, fund, or deploy from one budget |
Visibility is table stakes. The plan is the product.
New to TeamOhana? Read the founder's note on why we built this →Annual planning is weeks away
Next year's plan is missing a line.
The missing line is AI spend. 20 minutes with your own data fills it before the plan locks.
Price next year's plan
Onboarding is limited ahead of planning season. Early access is open now.