

Curious how TeamOhana can help you? Talk to us.
In this article
Never miss new content
Delayed hiring costs are the budget, productivity and timing effects of a role starting later than the workforce plan assumed. Workforce planning cost modeling is how finance puts a dollar figure on each of those effects, for one role or a whole plan, so leaders can decide what to do about a slip before it shows up in the quarter.
Before TeamOhana, I ran FP&A and strategic finance at Docker, where our hiring plan started in a spreadsheet and very quickly got out of hand. This guide covers how I model delayed hires and role changes today: the formulas, the worked examples, and the monthly rhythm that keeps finance, HR and talent on the same numbers.
Delayed hires are the default, not the exception
Every year you build an operating plan. Everyone wants their headcount now. Very often it doesn't get hired now. It gets hired two months later, sometimes two quarters later.
The data backs that up. SHRM's 2025 recruiting benchmarks put median time to fill at about a month and a half, and 61 days for nonexecutive roles at organizations with 5,000 or more employees. Time to fill stops at the accepted offer. Add a notice period and onboarding, and a role approved today rarely shows up on payroll inside a quarter.
Median time to fill is about six weeks, and 61 days for nonexecutive roles at organizations with 5,000+ employees. That's before notice periods and onboarding.
So if your plan assumes roles start the day they're approved, it's wrong on day one. Here's what that looks like in practice, from finance teams I've worked with this year:
- A hiring manager says, "I need this role tomorrow." Talent says they can probably fill it by the end of next quarter. Finance is left holding target start dates that are already in the past.
- A large gaming company found a variance of roughly 10% of its budget. The gap only showed up when they switched from annualized cost, which ignores start dates, to fiscal numbers. The cause, in their words, was that they weren't maintaining start dates as closely as they should.
- A global fintech's forecast sat about 13% under budget. In my experience, favorable variance like that almost always comes from two places: hiring later than the budgeted start dates, and salaries landing lower than planned.
An underspend like that feels like good news, because it looks like budget you can reallocate. It usually isn't. It means the plan, and every decision built on it, is out of date, and the business is making real decisions on the wrong numbers.
The three costs of a delayed hire
Every delayed hire impacts the plan in three places. Most finance teams model the first, guess at the second, and ignore the third.
The budget number is usually the one that gets reported. It's also the one most likely to make a delay look like good news. That's why you need all three.
1. Model the budget impact: fiscal vs. run rate
Here's the single most important thing to understand about a delayed hire: it defers spend, it doesn't save it. If you hire someone later than planned, the annualized impact is zero. What changes is when the dollars hit this fiscal year.
That's why you need two views of the same plan:
- Fiscal (in-year) cost takes start dates into account. Someone who starts halfway through the year costs half as much this year as someone who started on day one.
- Annualized (run-rate) cost ignores start dates. It tells you whether you're over or under on salaries, and what your cost base looks like going into next year.
What's the difference between fiscal and run-rate cost? Fiscal cost is what a role costs inside this fiscal year, based on its start date. Run-rate cost is its full annualized cost, regardless of start date. A delayed hire lowers fiscal cost but leaves run-rate cost unchanged.
Mix them up and your variance stops making sense. That's how the gaming company above found its 10% gap: the annualized view hid what the fiscal view showed.
Step 1: Get the fully loaded cost of the role. Base salary is never the real number. According to the Bureau of Labor Statistics, benefits made up 31.5% of total employer compensation costs for full-time private-industry workers in June 2026. Wages made up the other 68.5%, so benefits add roughly 46% on top of wages. Use your own load factor if you have one. Apply it only to the pay items it covers: bonus and variable comp are often taxed differently, and many benefits are a flat dollar amount rather than a percentage of pay.
Step 2: Calculate the fiscal-year cost at the planned and the new start date.
Step 3: Take the difference. That's the budget impact of the delay. Call it what it is: a deferred cost, not a saving. The run-rate impact stays at zero unless the pay itself changed too: salary, variable comp or bonus, usually because the level or location moved.
Worked example: one role, pushed 90 days
A role with a $180,000 fully loaded annual cost was budgeted to start April 1, in a fiscal year that runs January to December. Recruiting now expects July 1.
Pushing the role back a full quarter defers $45,000 of this year's spend. The run rate doesn't move at all. You've only changed when the business starts to incur the cost. Had the plan assumed July from the start, that $45,000 could have funded another team instead of sitting unused. And if the role was supposed to start in October and slips into January, the same $45,000 doesn't disappear. It lands in next year's budget, which someone should know about now.
2. Model the productivity impact: delay shifts the whole ramp
The budget view tells you what you didn't spend. The productivity view tells you what you didn't get. And it's almost always bigger than people expect, because of ramp.
New hires don't show up at full productivity. A typical sales ramp looks something like zero quota for the first three months, then 10%, 30%, 75%, and full quota from there. When a start date slips, you don't lose the first few months of that curve. Within the fiscal year, you lose the last few months, which are the most productive ones.
Worked example: an account executive pushed 90 days
An AE with an $800,000 annual quota (about $66,700 a month) was planned for April 1. The new start date is July 1. Same ramp as above, fiscal year January to December.
That's 3 full months of quota capacity gone, or about $200,000 of bookings capacity pushed out of the year. If the AE's fully loaded cost is $240,000, the delay "saves" $60,000 in budget. Finance reports a favorable variance. Sales misses its number.
A delayed hire defers spend. It doesn't save it. The budget line looks favorable while the business loses the output it was counting on.
For roles without a quota, estimate two things:
- Cover costs. Contractors, overtime, or a backfill agency covering the gap. These are real dollars, and they often sit in a different budget line, so nobody connects them to the open role.
- What doesn't ship. Ask the hiring manager what the role was supposed to deliver this year, and put a date on it. "The data platform migration moves from Q3 to Q1" is something a CFO can weigh. "We're stretched" isn't. Still, flag the cost you can't price: the people covering the empty seat are doing two jobs, with less focus on their own work, and that weighs on the team.
And don't forget the worst case. One fintech finance leader described a role that took three months to hire, the new hire exited at 90 days, and the seat sat empty for two more months. That's eight months of plan with almost nothing to show for it.
3. Model the timing impact across the whole plan
One delayed hire is a line item. Twenty delayed hires is a different forecast. This is where workforce planning cost modeling earns its keep.
Start with realistic start dates. A role that hasn't been filled can't have a start date in the past. That was always the first data-quality check I ran, because it's where forecasts quietly go wrong: the plan says the dollars started last month, when really they won't start for another one or two. During the planning cycle, I also added a month to most roles, because everyone asks for headcount "now," even when "now" isn't realistic. My rule of thumb, half joking: take whatever date the department leader gives you, add a month, and then tell them it's the date they gave you.
For every open role, use whichever is later:
Build time to fill from your own history, and split it by location. US and non-US roles almost never take the same time, mostly because of notice periods. When I ran this monthly, the rule was simple: anything without an open req got pushed out a month in one region and two months in a region where hiring ran slower. Roles already in progress were left to recruiters, because they're closer to the pipeline.
Work backward from the start date, too. If you want someone starting in January, they need to accept an offer by a certain date, which means recruiting needs to open the role by an earlier one. If that open date has already passed, the start date is already at risk. Almost nobody does this, and it's one of the easiest checks to run.
Then track slippage as a leading indicator. Each month, count three things: how many roles were hired in the month you planned, how many got pushed out, and how many got pulled in. A steady rise in push-outs tells you next quarter's forecast is too high before the variance shows it. It also tells you whether you can hire everyone at all. Say you planned 10 hires in Q2 and 10 in Q3 based on recruiting capacity, and only 5 landed in Q2. Now Q3 needs 15. You can bring in contract recruiters, ask recruiters to take on more, reprioritize and cut roles, or push Q3 hires into Q4 and later, which sets the plan back further every quarter.
Scenarios: decide before the money moves
Once start dates are realistic, you can ask the questions leadership actually cares about:
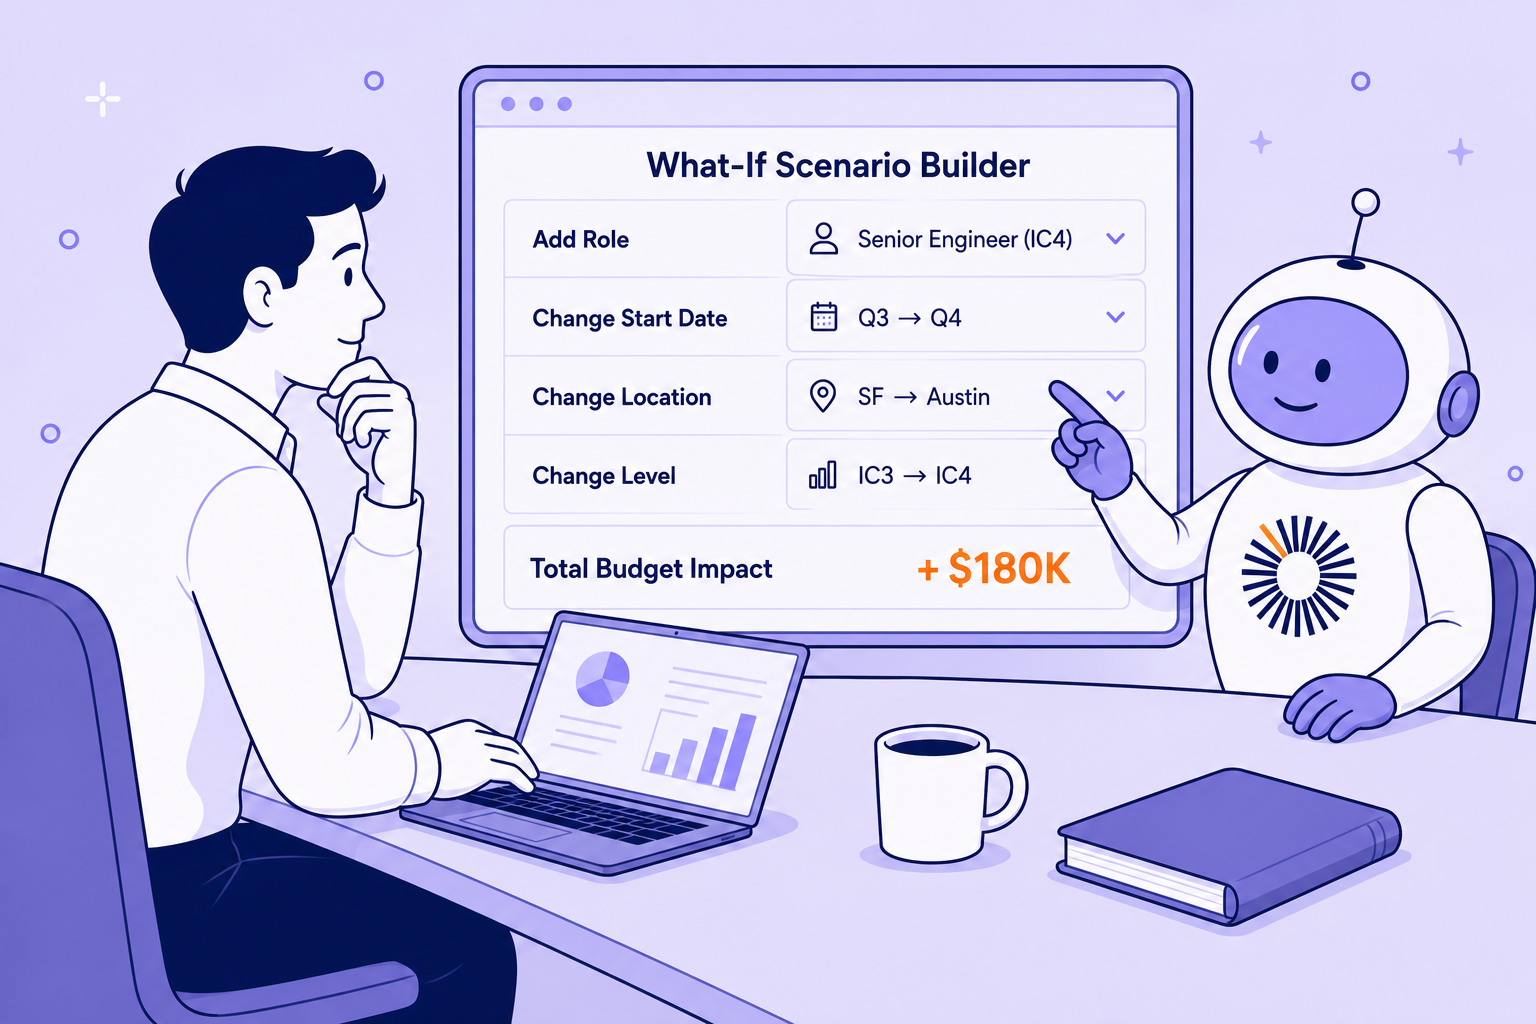
- "What if we push these four roles a full quarter?" In one demo I ran, a sales expansion added $2.8M of fiscal cost, and pushing four of its roles back 90 days brought that down to $2.5M.
- "Can we add five people and stay budget neutral?" Find roles that haven't started and have been deprioritized, and move them out a quarter. Adding five and pushing three is often close to neutral. Then the business can come back and say, "We're plus $12K. Is that budget neutral enough?" That's a much better conversation than a surprise at quarter-end.
- "What if we pull these in?" It works both ways. Pulling four roles forward by 30 days, with one pushed out, netted about $13K in one model. Small on its own, but these add up across a plan.
The point isn't the exact number. It's that every option comes with its dollar impact attached, before anyone commits to it. One caution: most of these moves defer cost rather than remove it. Pushing three roles to make room for five keeps this year neutral, but all five new roles still show up in next year's run rate.
4. Role change impact analysis: when the role itself moves
Start date delays shift when the business starts to incur the spend. Role changes shift how much it spends. In practice they often happen together, and if you don't separate them you can't explain your variance.
One strategic finance lead put it perfectly: managers forecast "two P5s who will cost $60,000 a year," then hire a P6 and a P7, both north of $80,000. The hires landed on time, but over budget. The plan just drifted, one approval at a time.
Run every role change through the same two-part math:
The first tells you about next year. The second tells you about this one, and it picks up any start date change that came along with the role change.
The changes that move cost the most:
Transfers deserve their own mention. Internal transfers used to blow up my spreadsheets. One move could create three separate rows. Finance often found out after the fact: I'd run the latest forecast and suddenly the AE team was up a million dollars and the BDR team was down, because a group of BDRs had been promoted to AE. If a cost center is up or down and they didn't hire anyone, transfers are the first place to look. The fix was simple: whoever knows first, usually the HR business partner, fills out a short form: which headcount is moving, when it's effective, and whether it needs a backfill.
When you report variance, keep date and pay separate. A role can be red on dates because it was pulled forward, and red on comp because it was hired at a higher rate, at the same time. Lumping them together hides both stories. Transfers add a third: a head that moves from department B to department A shows up as overspend in A and an equal underspend in B, even though total headcount didn't change.
Building it into headcount planning: a monthly rhythm
None of this works as a once-a-year exercise. The plan you lock in the budget cycle is out of date by spring. As Mike Tyson put it, everybody has a plan until they get punched in the face. What works is a short monthly rhythm that keeps finance, HR and talent on the same numbers, so the quarterly reforecast becomes a light update instead of a rebuild.
Here's the cadence I'd recommend, run at the end of each month:
- Recruiters update near-term dates first. Every open role assigned to them gets an updated start date, because they're closest to the pipeline.
- Finance business partners review the next three months with their business leads. This quarter and early next is where the dollars are most certain. Then look a little further out, so you're not just stacking every role into the same future month.
- Push out anything without an open req. Apply your time-to-fill rule by location, and clear every start date that's already in the past.
- Bring the head of recruiting into the monthly financial review. Just the first five minutes. Go through every to-be-hired role and ask: is this still the priority, or should it move out?
- Report variance three ways. Timing (earlier or later than planned), pay (higher or lower than planned), and scope (roles added that weren't in the budget). Show fiscal and annualized side by side.
- Keep each budget fixed. Track budget, target and actual separately for every role, and put stretch or gated roles in their own budget envelope. Most companies have more than one budget: the annual operating plan (AOP) at the start of the year, and often a new one halfway through. Save each as its own version. If you keep editing one budget all year, you'll lose track of why and when it changed.
- Run scenarios before approving changes. Any new role, re-scope or pull-forward gets its fiscal and run-rate impact attached before it's approved.
If you're looking for a shorter version to share with HR and recruiting, our workforce cost modeling checklist for open roles covers the essentials in one page.
Where TeamOhana fits
I've tried to do all of this in spreadsheets. Splitting variance on a rolling hiring plan is very hard to maintain by hand, and running a what-if means building it, checking it, and then reverting all the changes. And because hiring changes every week, the what-if you build today may be out of date by next week.
That's the problem TeamOhana was built to solve, and why I was a customer before I worked here. TeamOhana works alongside your HRIS and ATS, not instead of them. Every role carries its budget, target and actual cost, with fiscal and annualized views side by side. Start dates can be pushed in bulk, by a set number of days, to a calendar date, or to a recommended date based on your own historical time to hire. Variance splits into date, pay and scope automatically.
And with scenarios in TeamOhana Computer, you can ask "what if we push these four roles a quarter?" or "can we add five people and stay budget neutral?" and see the fiscal and run-rate impact before anyone commits. It won't replace your FP&A tool down to the penny. It will tell you, directionally and quickly, what a delay or a role change is going to cost.
See what connected headcount planning looks like for your finance team. Book a demo.
Take control of your headcount spend

Delayed hiring costs FAQs
Simplifying TeamOhana: your questions, answered.
Workforce planning cost modeling puts a dollar value on every decision in a workforce plan: new roles, start dates, delays, role changes and attrition. It shows the cost by role, team and month, in both fiscal-year and annualized terms, so finance, HR and talent can see the impact before a decision is made.
Start with the role's fully loaded annual cost. Multiply it by the months of delay that fall inside the fiscal year, divided by 12. That's the budget impact. Then estimate the productivity impact: lost output during the delay and ramp, plus any contractor or overtime cover. The annualized run-rate cost doesn't change unless the role itself changes.
Not really. A delay defers spend into later months or next year. It lowers this year's fiscal cost, but the run-rate cost is the same, and the lost output from an empty seat is often larger than the budget saved.
Role change impact analysis measures how a change to a role's level, location, scope or type moves its cost. Compare the new fully loaded cost to the budgeted cost on both a run-rate and a fiscal basis, and report it separately from start date changes.
Good headcount planning uses realistic start dates based on historical time to fill by location, clears start dates that are already in the past, and refreshes them monthly with recruiting. Scenarios then show what pushing or pulling roles would do to the forecast.
Forecast existing employees plus the roles you still expect to hire, at their target cost and realistic start date. Track budget, target and actual separately, and split variance into timing, pay and scope so you can explain what changed and why.