
Curious how TeamOhana can help you? Talk to us.
In this article
Never miss new content
Hiring demand forecasting is the practice of predicting how many roles your recruiting team will actually need to fill, month by month, from every source: approved new roles, backfills from attrition, internal moves, pending requests, and the off-plan hires that always show up. It's the first half of recruiter capacity planning. You can't match recruiters to the work until you know how much work is coming.
Most teams skip this step. They treat the approved headcount plan as the demand number and size recruiting against it. Then backfills land, a few "must-have" roles appear mid-quarter, and recruiters end up carrying far more than anyone planned for.
This guide walks through how recruiting ops and finance teams can build a hiring demand forecast together, turn it into recruiter workload, and keep it current with a monthly workflow. If you're new to the topic, start with our explainer on what recruiter capacity planning is. If you already have your capacity math, this guide covers the demand number to compare it against.
Why recruiter capacity planning starts with demand, not recruiters
The approved plan is a budget decision, and it doesn't forecast recruiting work. The two drift apart quickly, and recruiters absorb the difference.
Finance and talent leaders describe this gap on customer calls regularly. The FP&A lead at a fast-growing software company said: "We sign off a plan and then we hire people completely different." The CFO at the same company said annual plans are "already outdated a week after they've been adopted." At an AI infrastructure company, a talent lead described quarterly approvals that start at 80 roles and end up at 92.
Plans go stale because people leave, teams reorganize, and new needs come up every week rather than once a quarter. Turnover alone is constant: the U.S. Bureau of Labor Statistics reported 5.3 million total separations in September 2026, a rate of 3.3% of employment in a single month (BLS JOLTS). Every one of those exits is a potential backfill that never appeared in anyone's annual plan.
The data side is thin, too. Gartner found that only 31% of recruiting functions use labor market data to shape their business and talent strategies (Gartner). That means most recruiting teams are planning without outside data on the labor market.
The question to answer is how many roles recruiting will actually have to fill, and when. That number is your hiring demand forecast.
The approved plan tells you what Finance agreed to fund. The hiring demand forecast tells you how many roles recruiting will actually have to fill, and when.
The five sources of hiring demand
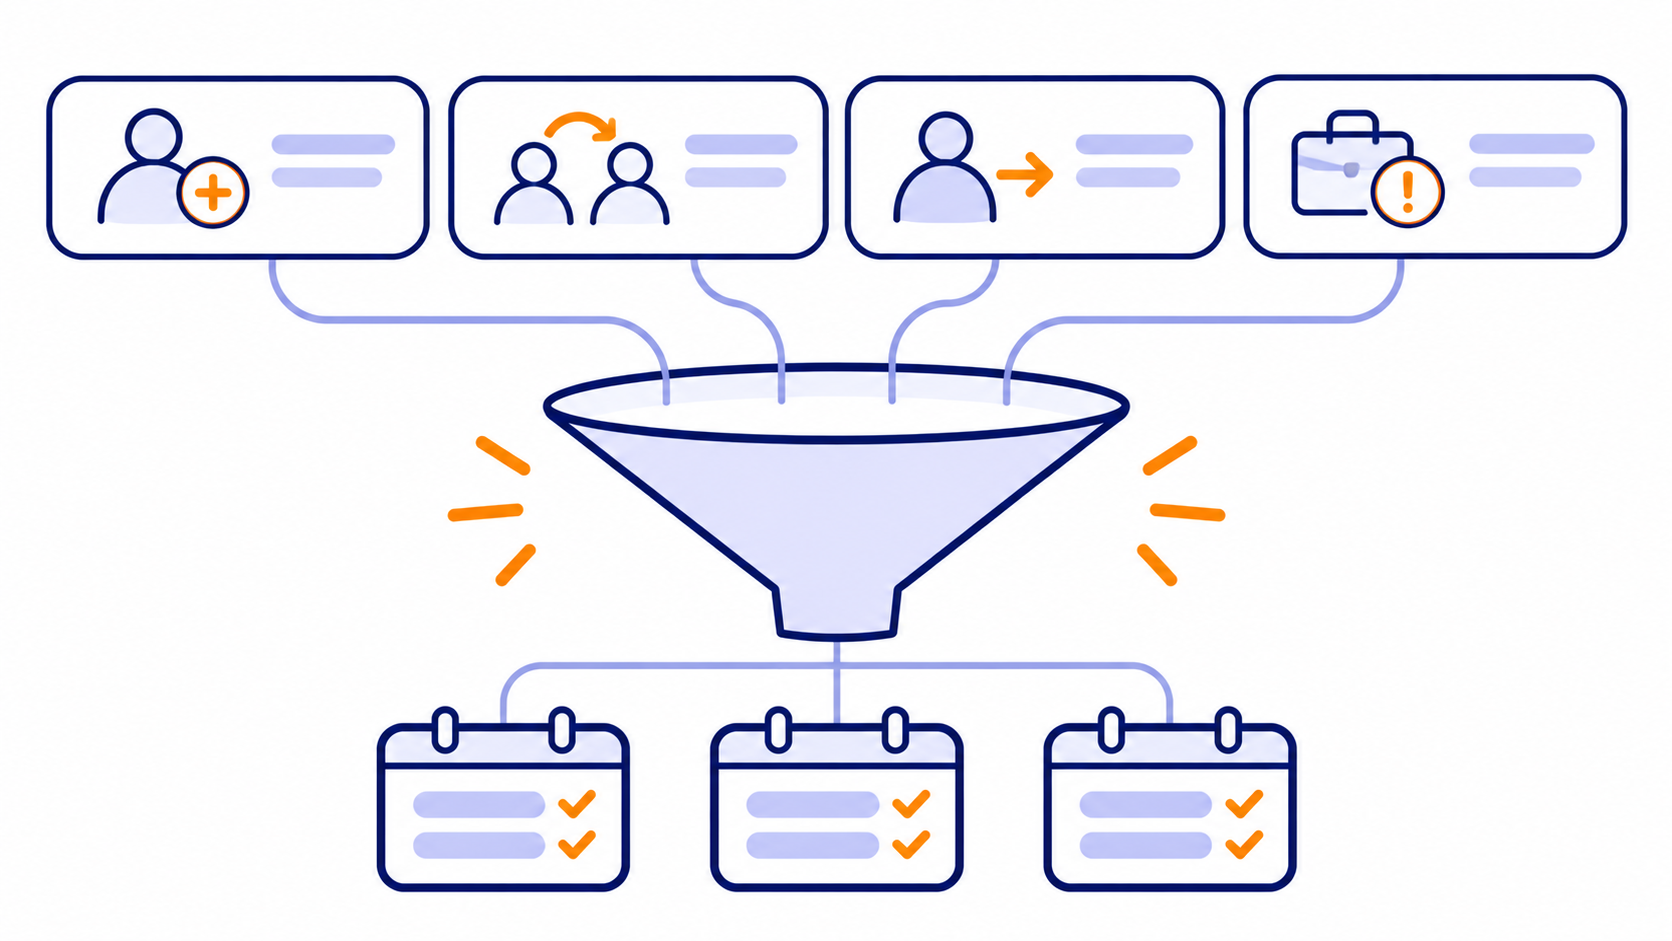
A real hiring demand forecast adds up five streams. Only the first one lives in the approved plan.
| Demand source | Where it comes from | How to forecast it | Who owns the input |
|---|---|---|---|
| Approved new roles | The headcount plan Finance signed off | Use the plan, but by target start month, not by quarter | Finance and department leaders |
| Backfills | Employees who leave and get replaced | Trailing 12-month attrition by team × your backfill rate | HRBPs and People Ops |
| Internal moves | Transfers and promotions that leave a seat open | Trailing average of internal moves that needed a backfill | HRBPs |
| Pending requests | Roles requested but not yet approved | Count of open requests × your historical approval rate | Finance and approvers |
| Off-plan hires | The "we found someone amazing" roles | A small buffer based on last year's off-plan hires | Leadership |
Backfills are the stream teams most often leave out. An HR business partner at a fast-growing AI company told us her team didn't track backfills at all, so when people left, managers assumed they could hire three more. A talent ops leader at a public SaaS company said leaders were "known to kind of sit on backfills," until Finance started pulling the backfill count into its monthly forecast. Now every exit gets a decision: backfill it, or mark it ineligible.
Internal moves create demand twice. A transfer fills one seat and opens another. If your forecast only counts external hires, every internal move looks like free headcount, but someone still has to recruit for the seat that was left behind.
Pending and off-plan roles need probabilities. Not every request gets approved, and not every quarter brings a surprise executive hire. Use last year's approval rate and last year's off-plan count. A rough estimate is more useful than assuming the number is zero.
How to build a monthly hiring demand forecast
Forecast by month, not by quarter. Quarterly totals hide the biggest problem in recruiting workload: roles don't arrive evenly. A TA leader we spoke with described hiring managers who were "particularly bad at setting dates," so a huge bucket of approved heads landed at the start of every quarter.
Here's how to build it in five steps:
- Lay out approved new roles by target start month. If a role has no start month, it isn't plannable yet. Send it back to the hiring manager.
- Add expected backfills. Multiply current headcount by your monthly attrition rate, then by the share of exits you actually backfill.
- Add internal moves. Use your trailing monthly average of transfers and promotions that needed a backfill.
- Add weighted pending requests. Multiply open requests by your historical approval rate, and place them in the month after you expect approval.
- Add an off-plan buffer. Base it on how many unplanned hires you made last year.
Worked example. Take a 600-person company heading into Q1. Finance approved 45 new roles for the quarter. Here's what recruiting is really facing:
- Backfills: 15% annual attrition on 600 people is about 7.5 exits a month. They backfill 80%, so plan for 6 a month.
- Internal moves: 2 a month on average leave a seat that needs a backfill.
- Pending requests: 12 roles are waiting for approval, and about half usually get approved, so 6 expected, landing in February and March.
- Off-plan: last year brought about 12 unplanned hires, so plan for 1 a month.
| Demand source | January | February | March | Q1 total |
|---|---|---|---|---|
| Approved new roles | 20 | 15 | 10 | 45 |
| Backfills | 6 | 6 | 6 | 18 |
| Internal moves | 2 | 2 | 2 | 6 |
| Pending requests (weighted) | 0 | 3 | 3 | 6 |
| Off-plan buffer | 1 | 1 | 1 | 3 |
| Total hiring demand | 29 | 27 | 22 | 78 |
The plan said 45. Recruiting will actually need to open about 78 roles, roughly 73% more. And January carries the most, because that's when post-planning approvals land.
In this example, Finance approved 45 roles for Q1, but recruiting will need to open about 78. That's roughly 73% more work than the approved plan shows.
The formula behind it is simple:
Use your own rates. National turnover data is a sanity check, not an input. BLS separation rates vary widely by industry, from 1.7% a month in finance and insurance to 4.2% in professional and business services in September 2026 (BLS JOLTS).
Turn hiring demand into recruiter workload
Seventy-eight roles is not 78 units of work. A high-volume sales role and a staff machine learning engineer don't take the same effort, and pretending they do is how one recruiter ends up buried while another has room.
The fix is to weight each role by difficulty. Keep it to three tiers so people actually use it:
| Tier | Typical roles | Weight |
|---|---|---|
| Standard | Sales development, customer support, most G&A roles | 1.0 |
| Specialized | Senior engineering, product, finance, account executives | 1.5 |
| Hard to fill | Executives, niche technical roles, new locations | 2.5 |
Set the weights from your own history. If your hard-to-fill roles took two and a half times as long to close as standard roles last year, 2.5 is your number.
What is weighted recruiting workload? Weighted workload counts each open role by how hard it is to fill, so one hard-to-fill role counts as 2.5 standard roles. It turns a list of open reqs into a number you can compare directly against recruiter capacity.
Back to our example. Of the 78 roles in Q1, 50 are standard, 22 are specialized, and 6 are hard to fill:
- 50 × 1.0 = 50
- 22 × 1.5 = 33
- 6 × 2.5 = 15
- Total weighted workload: 98 units
That 98 is the number to compare against your recruiters' capacity, measured in the same units. Our recruiter capacity planning guide walks through how to calculate capacity from your own data.
Match capacity to demand: find the gap, then pick your lever
Once demand and capacity are in the same units, hiring plan alignment comes down to subtraction.
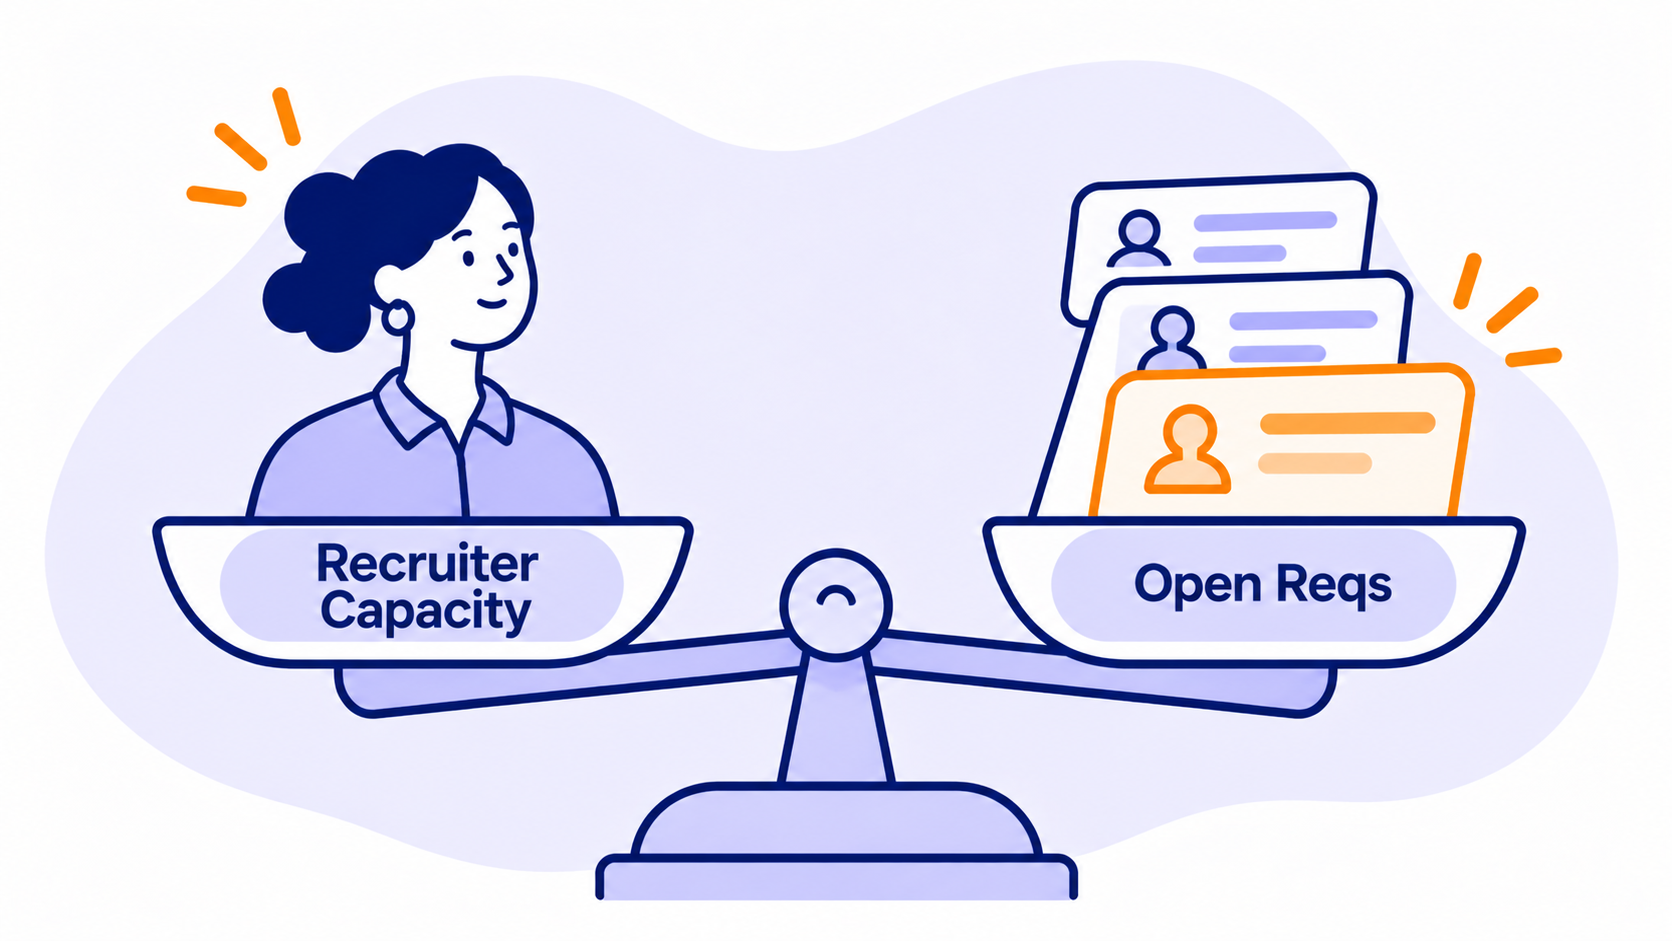
Say our example company has 6 recruiters, and last year each delivered about 12 weighted units a quarter. That's 72 units of talent acquisition capacity against 98 units of demand, a gap of 26. In plain terms, roughly a quarter of Q1's hiring won't happen on time unless something changes.
That replaces a vague "recruiting is behind" with a specific gap you can discuss. Here are the levers for recruiting resource allocation, and when each one makes sense:
| Lever | What it does | Use it when |
|---|---|---|
| Re-sequence start dates | Moves some roles into later months | The plan is front-loaded and the business can wait a few weeks |
| Prioritize and defer | Ranks roles and pushes the lowest out a quarter | Leadership agrees which hires matter most this quarter |
| Add agency or contract recruiters | Adds temporary capacity | The gap is in standard or high-volume roles |
| Gate on readiness | Opens a role only when it has a job description, interview plan, and available recruiter | Approved roles are piling up before managers are ready |
| Fill from inside | Covers some demand with internal mobility | Strong internal candidates exist, and the backfill is easier to fill |
The readiness gate solves a specific problem. A VP of People at a software company told us they didn't want managers to invent a role and then ask why it hadn't been filled for three months. A separate "ready to hire" step fixes that. Approved roles wait in a queue, and recruiting pulls the next one only when it has capacity.
One warning about agencies: they're a fine short-term lever, but expensive as a strategy. The FP&A lead we quoted earlier said they'd backloaded the plan, it still felt unrealistic, and they ended up onboarding a lot of agencies. If you need agencies every quarter, you probably need more recruiters.
The cross-functional workflow: who owns what, and when
Recruitment workforce planning breaks down when each team updates its own numbers on its own schedule. A People leader at an AI infrastructure company described the pattern: Finance updates the numbers when there's a forecast, usually right before the next quarter, so recruiting spends weeks working from stale data.
The fix is one shared forecast with clear owners:
| Team | Owns | Updates |
|---|---|---|
| Finance | Approved roles, budget, approval rates | Approvals as they happen; plan changes monthly |
| HRBPs and People Ops | Attrition, backfill decisions, internal moves | Each exit and transfer as it happens |
| Hiring managers | Start dates and role readiness | Before a role moves to "ready to hire" |
| Recruiting ops | Difficulty tiers, capacity, recruiter assignments | Monthly |
| Leadership | Priorities and off-plan approvals | At the monthly review |
Then run it on a monthly rhythm:
- Week 1: Refresh actuals. Pull hires, exits, transfers, and approvals from last month.
- Week 2: Re-forecast demand. Update all five streams for the next three months.
- Week 3: Joint review. Finance, People, and Recruiting look at demand, capacity, and the gap together, and agree on which levers to pull.
- Week 4: Release roles. Move the next set of ready roles into recruiting and assign recruiters.
Keep the joint review short. Its job is to get Finance, People, and Recruiting working from the same number before decisions are made.
Six hiring demand forecasting mistakes to avoid
- Using the approved plan as the forecast. The plan is one of five demand streams. In our example it was less than 60% of the real number.
- Counting backfills only after someone resigns. Attrition is predictable at the team level. Forecast it before it happens.
- Treating "approved" as "ready." A role without a start date, job description, or interview plan isn't demand recruiting can work on yet.
- Forecasting by quarter. Quarterly totals hide the January pile-up. Monthly is the minimum.
- Weighting every role the same. Ten SDRs and ten staff engineers are not the same quarter for your recruiting team.
- Ignoring what slippage costs. When demand outruns capacity, start dates slip, and that has a real budget and productivity cost. Our guide to delayed hiring costs shows how to model it.
Where TeamOhana fits
Many teams build this forecast in a spreadsheet that goes stale between reviews. TeamOhana works alongside your HRIS and ATS as the headcount planning layer, so all five demand streams live in one place:
- Approved roles with real start dates. Every new role, backfill, and transfer starts as a headcount request with level, location, target start date, and budget attached.
- Backfills you can't lose track of. When someone leaves, the exit shows up with a backfill decision waiting, so it lands in the forecast instead of in someone's inbox.
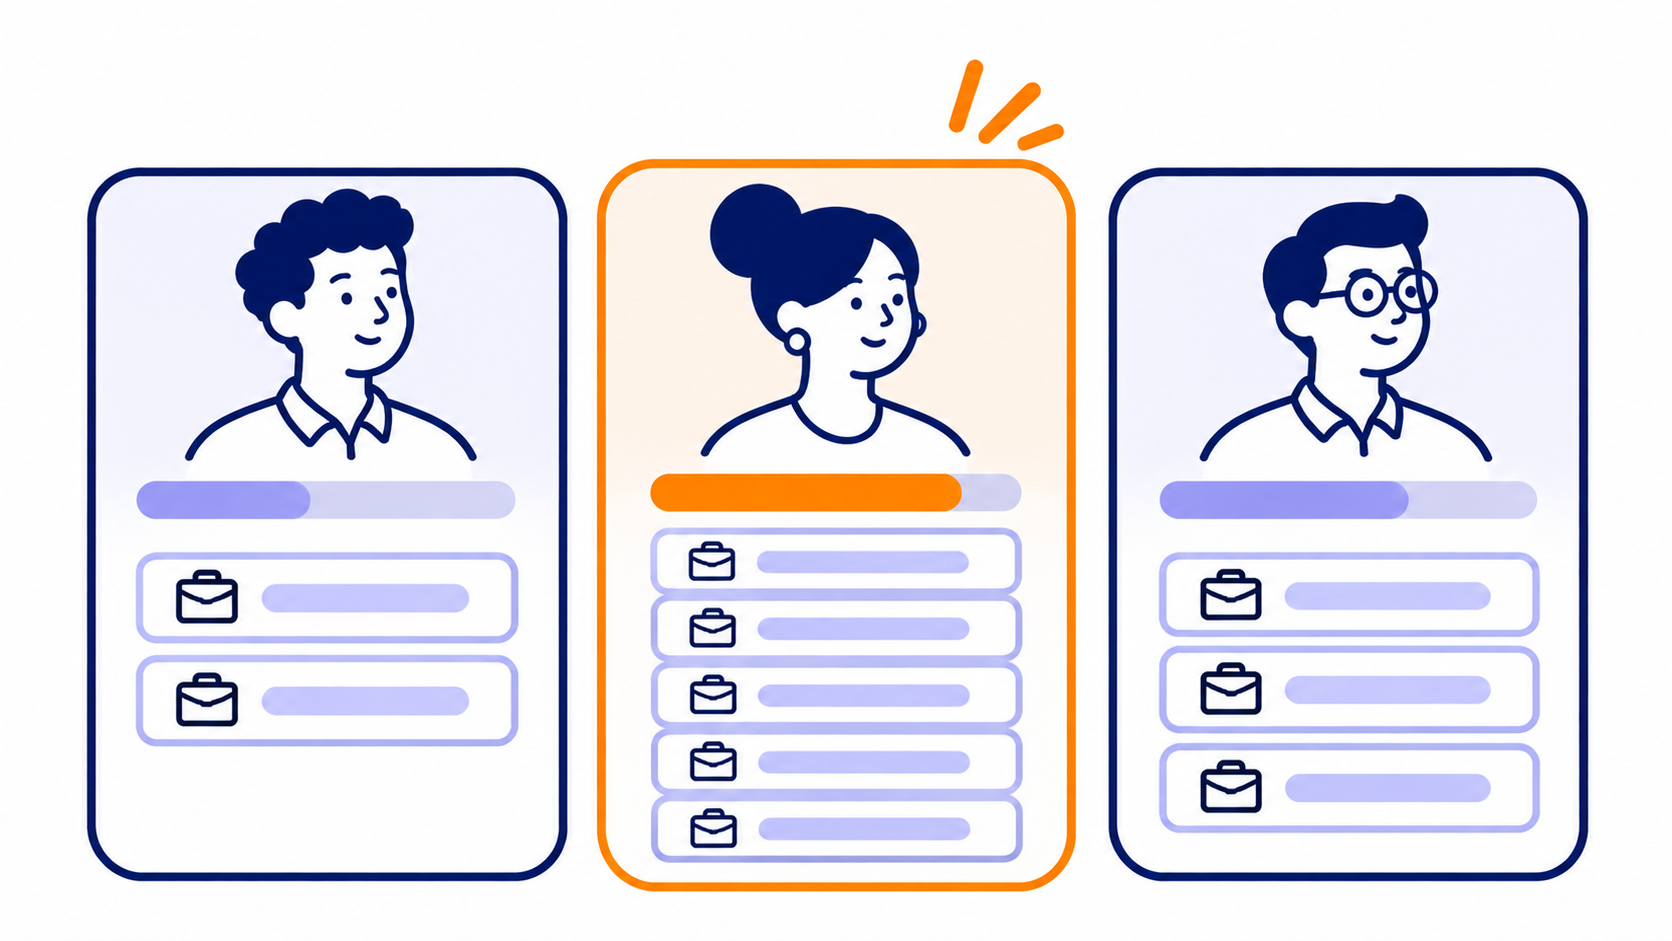
- Recruiter capacity against demand. Talent teams can track how many open reqs each recruiter carries and see whether roles are on track, at risk, or past due.
- A ready-to-hire gate. Approved roles wait in a queue until recruiting has capacity, then push to your ATS as openings.
- Scenarios in plain language. With TeamOhana Computer, leaders can ask what happens to recruiting workload if Q1 hires slip a month or attrition ticks up, and get the answer from live data.
Finance, People, and Recruiting work from the same forecast, so the monthly review can go to decisions instead of reconciling spreadsheets.
See how TeamOhana connects your headcount plan to every system your team uses. Book a demo.
Take control of your headcount spend

Hiring demand forecasting FAQs
Simplifying TeamOhana: your questions, answered.
Hiring demand forecasting predicts how many roles your recruiting team will need to fill, by month, from approved new roles, backfills, internal moves, pending requests, and off-plan hires. It's the demand side of recruiter capacity planning.
Demand forecasting estimates how much recruiting work is coming. Recruiter capacity planning compares that work with what your recruiters can deliver and decides how to close the gap. You need both for hiring plan alignment.
The plan only covers new roles. Backfills, internal moves, pending requests, and off-plan hires also add to recruiting workload. In this guide's worked example, they added about 73% on top of the approved plan.
Multiply current headcount by your monthly attrition rate, then by the share of exits you typically backfill. Use your own trailing 12 months of data by team, not a national average.
Monthly at minimum. Approvals, exits, and transfers change every week, so a quarterly forecast is usually stale by the time recruiting acts on it.
Recruiting ops usually owns the forecast and capacity model. Finance owns approved roles and budget, HRBPs own attrition and internal moves, and hiring managers own start dates and readiness. Review it together every month.
Weight roles by difficulty, then choose a lever: re-sequence start dates, defer lower-priority roles, add agency or contract recruiters for standard roles, gate roles on readiness, or fill some demand internally.