.png)
.svg)
In this article
Never miss new content
There is a person at every company who holds it all together. They go by different titles: HR Ops lead, People Ops manager, FP&A analyst, Recruiting Ops director. The title varies. The job does not.
They are the human API of the organization.
Every Monday, someone in leadership needs a number. How many open reqs do we have? Are we on plan? What is our attrition rate? How does our comp ratio look? Where are we over budget on offers? The question takes ten seconds to ask. The answer takes days to assemble.
Because the answer does not live in one place. It lives in the ATS, the HRIS, the FP&A tool, three spreadsheets, a Slack thread from two weeks ago, and the institutional memory of someone who has been in the role long enough to know where the bodies are buried. The ops person downloads reports from each system, reconciles the data manually, formats it into something presentable, runs it by Finance to make sure the numbers match, and delivers it to the leader who asked. By the time the answer arrives, the question has sometimes changed.
This is the daily reality of the people running HR Ops, People Ops, Finance Ops, and Recruiting Ops at every company above a few hundred employees. They are the most overworked and under-tooled people in the organization.
In a recent post, I argued that AI will only transform the enterprise where the foundation already exists: structured context, native permissions, and embedded workflow. This post is about what that transformation looks like for the people who need it most.
The reporting stack from hell
We have seen this firsthand. When we work with customers, one of the first things we ask is: show us your reporting stack.
The list is always some version of this:
- Budget adherence: are we spending what we planned, by department, by quarter?
- Hiring performance to plan: are we hitting our targets, and where are we behind?
- Role mutations: how many times did we uplevel a role, split a role, convert from contractor to FTE?
- Attrition analysis: who left, when, from which teams, and what is the trend?
- Approval cycle times: how long does it take to get a req approved, from request to green light?
- Time to hire: from approved req to start date, how long is the pipeline?
- Offer compliance: where do we have offers over budget, and how often does it happen?
- On-time vs. delayed hiring: which roles are on track and which are slipping?
- Tenure analysis: how long are people staying, and where is early turnover concentrated?
- Comp ratio analysis: are we paying competitively, and where are the gaps?
- Org growth analysis: how are teams growing, which regions are expanding, what does span of control look like by manager?
- Internal and external benchmarking: how do we compare to ourselves over time, and how do we compare to the market?
Every one of these reports is assembled manually. Every one requires data from at least two systems, often four or five. Every one takes hours to build, has to be rebuilt the next time someone asks a slightly different question, and is stale by the time it reaches the person who needs it.
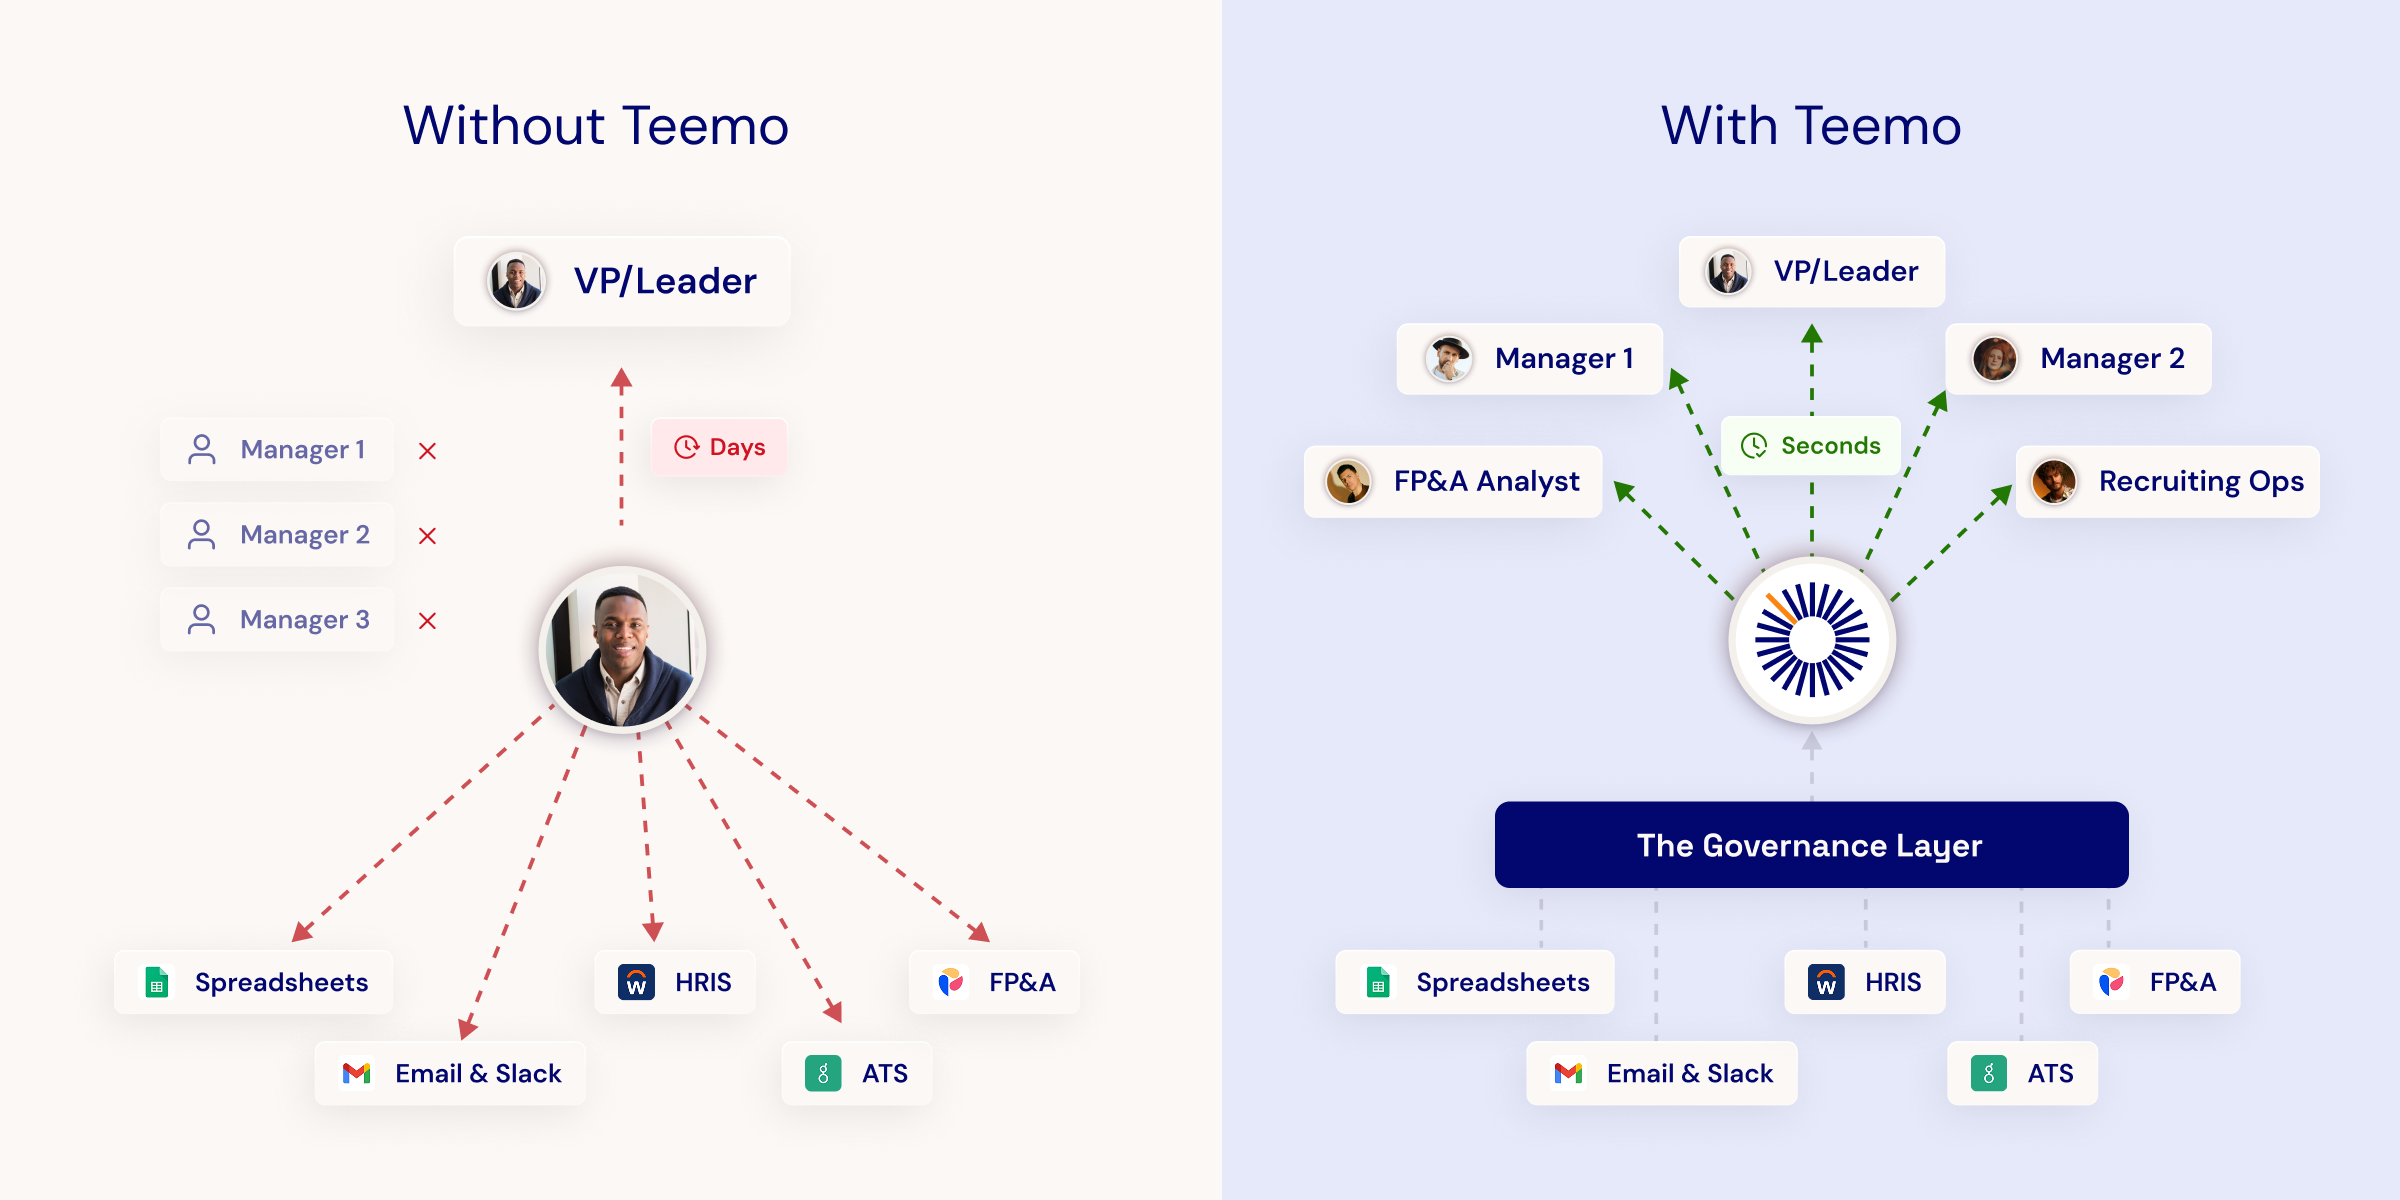
This is not a reporting problem. It is a structural problem. The ops person has become the middleware between fragmented systems and the leaders who need answers. They spend 60 to 70 percent of their time downloading CSVs and reconciling numbers in spreadsheets.
Your ops team is not an analytics department. They are strategic operators trapped in a reporting job. Stop asking them to be the human middleware between your systems and your leaders.
The job that should exist vs. the job that does
Here is what a great HR Ops or Finance Ops leader should be doing: advising the business on workforce strategy, identifying patterns that leadership cannot see from their vantage point, flagging risks before they become problems, and designing processes that scale as the company grows.
Here is what they actually do: download reports from the ATS, HRIS, and FP&A tool, reconcile the numbers against last month’s headcount spreadsheet, format it into slides, send it to Finance for validation, wait for corrections, update, deliver, and start over next week when someone asks a different question.
The gap between those two jobs is the entire cost of not solving this problem.
And it is worse than it looks, because the reporting work does not just consume time. It displaces the strategic work that ops leaders actually want to do and that the business desperately needs them to do. They want to build early warning signals for attrition risk before a team loses three people in a quarter. They want to identify patterns in hiring velocity that predict where the plan will break six weeks from now. They want to model org design scenarios that align team structure to business strategy. They want to be proactive, not reactive. But proactive work requires margin. And the reporting stack leaves none.
The hiring manager gets nothing
Workforce analytics, when they do get produced, only flow uphill. The CHRO gets the board deck. The VP of People gets the quarterly workforce review. The FP&A analyst gets the budget variance report. But the hiring manager running a team of 8 to 15 people? They get nothing.
Not because nobody cares about them. Because there are never enough resources on the ops team to serve everyone. The ops team has three people. The organization has sixty hiring managers. The math does not work. So the ops team triages: leadership gets the analysis, and everyone else manages their teams on instinct, memory, and whatever their recruiter told them last week.
This means the people making the most frequent workforce decisions in the company—the managers who approve reqs, choose between backfills and net-new roles, decide when to convert a contractor, and set the hiring priorities for their teams—are doing so completely blind. They do not know if they are on plan. They do not know their budget position. They do not know how their time-to-hire compares to the rest of the org. They are making consequential decisions without data, every single day.
This is the problem an on-demand analyst solves. Not just for the VP. For every manager in the organization. Teemo does not triage. It scales. A hiring manager with 10 direct reports gets the same quality of analysis as the CHRO preparing for a board meeting. The analyst is always available, always current, and never has to choose who to serve first.
What happens when you give ops an on-demand analyst
Teemo is TeamOhana’s AI Workforce Analyst. It sits inside the governance layer where all of your workforce data is already structured, connected, and permissioned. It does not need to pull reports from five systems. It already has the data. All of it. Live.
When an ops leader asks Teemo a question, they are not asking a chatbot. They are asking an analyst that already knows the headcount plan, the budget, the org structure, the open reqs, the pipeline, and the hiring velocity. The analyst answers in seconds. Not because it is fast. Because it does not have to assemble the context. The context is already there.
Here is what that means for the reports your ops team builds every week.
Monday morning: the CEO wants to know where we stand on hiring
WITHOUT TEEMO
The VP of People pings the HR Ops lead. The HR Ops lead opens the ATS, exports all open reqs, then opens the headcount plan spreadsheet, cross-references which reqs are approved vs. which are still pending, checks the budget tracker to see if the funded number matches, pulls pipeline data to estimate which roles will close this quarter, formats everything into a summary, runs it past Finance, gets a correction on two line items, updates the summary, sends it to the VP, who sends it to the CEO. Elapsed time: one to three days.
WITH TEEMO
The VP of People opens TeamOhana and asks Teemo: "Are we on track to hit our hiring plan this quarter?" Teemo responds in seconds with a breakdown by department: 68% to plan overall, Engineering behind due to two reqs stuck in approval, Sales on track, G&A ahead. The answer includes which reqs are at risk, why they are at risk, and what the budget impact is if they all close or if the delayed ones slip to next quarter. The VP forwards the answer to the CEO. Elapsed time: under a minute.
Mid-quarter: Finance needs to know where we are over budget on offers
WITHOUT TEEMO
The FP&A analyst asks HR Ops for a report on offer compliance: which accepted offers came in over the approved compensation band, by how much, and in which departments. The HR Ops lead pulls offer data from the ATS, comp bands from the HRIS, and approved budgets from the headcount plan. They manually compare each offer against the band, flag exceptions, calculate the variance, and build a report. This takes a full day, sometimes two. By the time it is done, three more offers have gone out.
WITH TEEMO
The FP&A analyst asks Teemo: "Where do we have offers over budget this quarter?" Teemo returns a list: four offers in Engineering exceeded the band by an average of 12%, one in Product by 8%. It shows the approved band, the actual offer, the variance, and who approved each exception. The FP&A analyst follows up: "What is the annualized budget impact of these overages?" Teemo calculates it on the spot. Total elapsed time: two minutes.
Board prep: the CHRO needs org growth, attrition, and comp analysis in one place
WITHOUT TEEMO
Board prep is a multi-week exercise. The People Ops team pulls attrition data from the HRIS, slices it by department, tenure, and level. They pull comp ratios from a separate compensation tool or spreadsheet. They build org growth analysis manually by comparing this quarter’s headcount to last quarter’s, by team and region. They analyze manager span of control by counting direct reports per manager in the org chart. They compare internal trends to external benchmarks from third-party surveys. Each of these is a separate workstream that takes days. Reconciling them into a coherent board narrative takes another day. The CHRO’s chief of staff has been working on this for two weeks.
WITH TEEMO
The CHRO asks Teemo a series of questions in a single session. "What does attrition look like this quarter vs. last quarter, by department?" Answered. "Where is early turnover concentrated?" Answered. "Show me org growth by region over the last four quarters." Answered. "What is the average span of control in Engineering vs. Sales?" Answered. "How does our comp ratio for senior engineers compare to the band?" Answered. Each response comes back in seconds, drawn from live data that was governed in TeamOhana from the start. The chief of staff’s two-week project is now a 30-minute conversation.
Why this is not a dashboard
You can build a dashboard for any of the questions above. The problem is that you have to build a separate dashboard for each one. And when someone asks a question that does not match an existing dashboard, you are back to the ops person pulling CSVs.
Dashboards are static views of predetermined questions. They answer the questions you anticipated. They do not answer the questions you did not. And in workforce planning, the questions you did not anticipate are the ones that matter most. What happens if we freeze hiring in two departments but not a third? What is the budget impact if three offers that are in flight right now all close above band? If we lose two more senior engineers this quarter, what does that do to our plan?
These are not dashboard questions. These are analyst questions. They require someone who understands the full context and can reason through the implications in real time. That is what Teemo does. It does not show you a chart and let you interpret it. It interprets the data and tells you what it means for your plan, your budget, and your org.
Dashboards answer the questions you anticipated. An analyst answers the ones you did not. Teemo is the analyst.
The strategic unlock
When you take the reporting burden off the ops team, they stop being the middleware and start being the advisor.
The HR Ops lead who used to spend three days assembling a headcount reconciliation report now spends that time identifying patterns: which teams are consistently over budget on offers and what is driving it. The FP&A analyst who used to spend a week building board prep materials now spends that time advising the CFO on where to allocate headcount next quarter. The Recruiting Ops director who used to manually track hiring velocity against plan now spends that time redesigning the intake process to cut approval cycle times by half.
These are the jobs they were hired to do, the jobs the company needs them to do. And they cannot do them when they are stuck in the reporting stack.
Teemo does not replace the ops person. It replaces the part of their job that should not exist: the manual assembly of context from fragmented systems into answers for other people’s questions. That work is an analyst’s job. Teemo is the analyst.
The question for ops leaders
If you run People Ops, HR Ops, Finance Ops, or Recruiting Ops, ask yourself: what percentage of your week is spent assembling reports from fragmented systems? If the answer is more than 20 percent, you do not have a tooling problem. You have a structural problem. Your systems do not talk to each other, your data is not governed in one place, and you are the human glue holding it all together.
That is the problem TeamOhana was built to solve. And Teemo is how the solution shows up in your day-to-day: an AI Workforce Analyst that already has the context, already respects the permissions, and already sits inside the workflow where workforce decisions happen.
Your ops team should be the strategic advisor to the business, not the reporting function. Teemo makes that possible.
Take control of your headcount spend

On-demand workforce analyst FAQs
Simplifying TeamOhana: your questions, answered.
Workforce reports go stale because they are built manually from point-in-time exports. By the time an ops team member downloads data from the ATS, cross-references it against the headcount plan, validates it with Finance, and formats it into a deliverable, the underlying data has moved. Offers have gone out. Reqs have been approved or frozen. Headcount has changed. The report captures a moment that no longer exists. The problem is not effort. It is that manually assembled reports cannot keep pace with a live workforce.
Dashboards answer the questions you anticipated when you built them. They do not answer the questions you did not anticipate — and in workforce planning, the unanticipated questions are usually the most important ones. What happens to the budget if three in-flight offers close above band? What does the hiring plan look like if one department freezes for a quarter? Those questions require someone who understands the full context and can reason through the implications in real time. A dashboard shows you a chart. An analyst tells you what it means.
A dashboard is a static view of predetermined questions. It requires someone to decide in advance what to measure and how to display it. When the question changes, someone has to rebuild the dashboard or go back to pulling spreadsheets. An AI workforce analyst operates on live, structured data and answers questions as they are asked — including follow-up questions, scenario questions, and questions that were never anticipated at build time. The dashboard is a report. The analyst is a conversation.
Teemo can answer questions about budget adherence, hiring performance to plan, offer compliance, attrition trends, time-to-hire, role mutations, org growth, comp ratios, approval cycle times, and span of control — among others. It can also answer follow-up questions and scenario questions: what is the annualized cost impact of current offer overages? What does the plan look like if two reqs that are at risk slip to next quarter? These are analyst questions, not report questions, and Teemo handles them in real time.
Without an AI workforce analyst, board preparation for workforce data is typically a multi-week exercise. People Ops pulls attrition from the HRIS, comp ratios from a separate tool, org growth from manual headcount comparisons, and span of control from the org chart — each a separate workstream, each taking days to complete, plus additional time to reconcile them into a coherent narrative. With Teemo, the same board preparation becomes a 30-minute conversation. Each question — attrition by department, early turnover concentration, regional org growth, comp ratio analysis — is answered in seconds from live governed data.